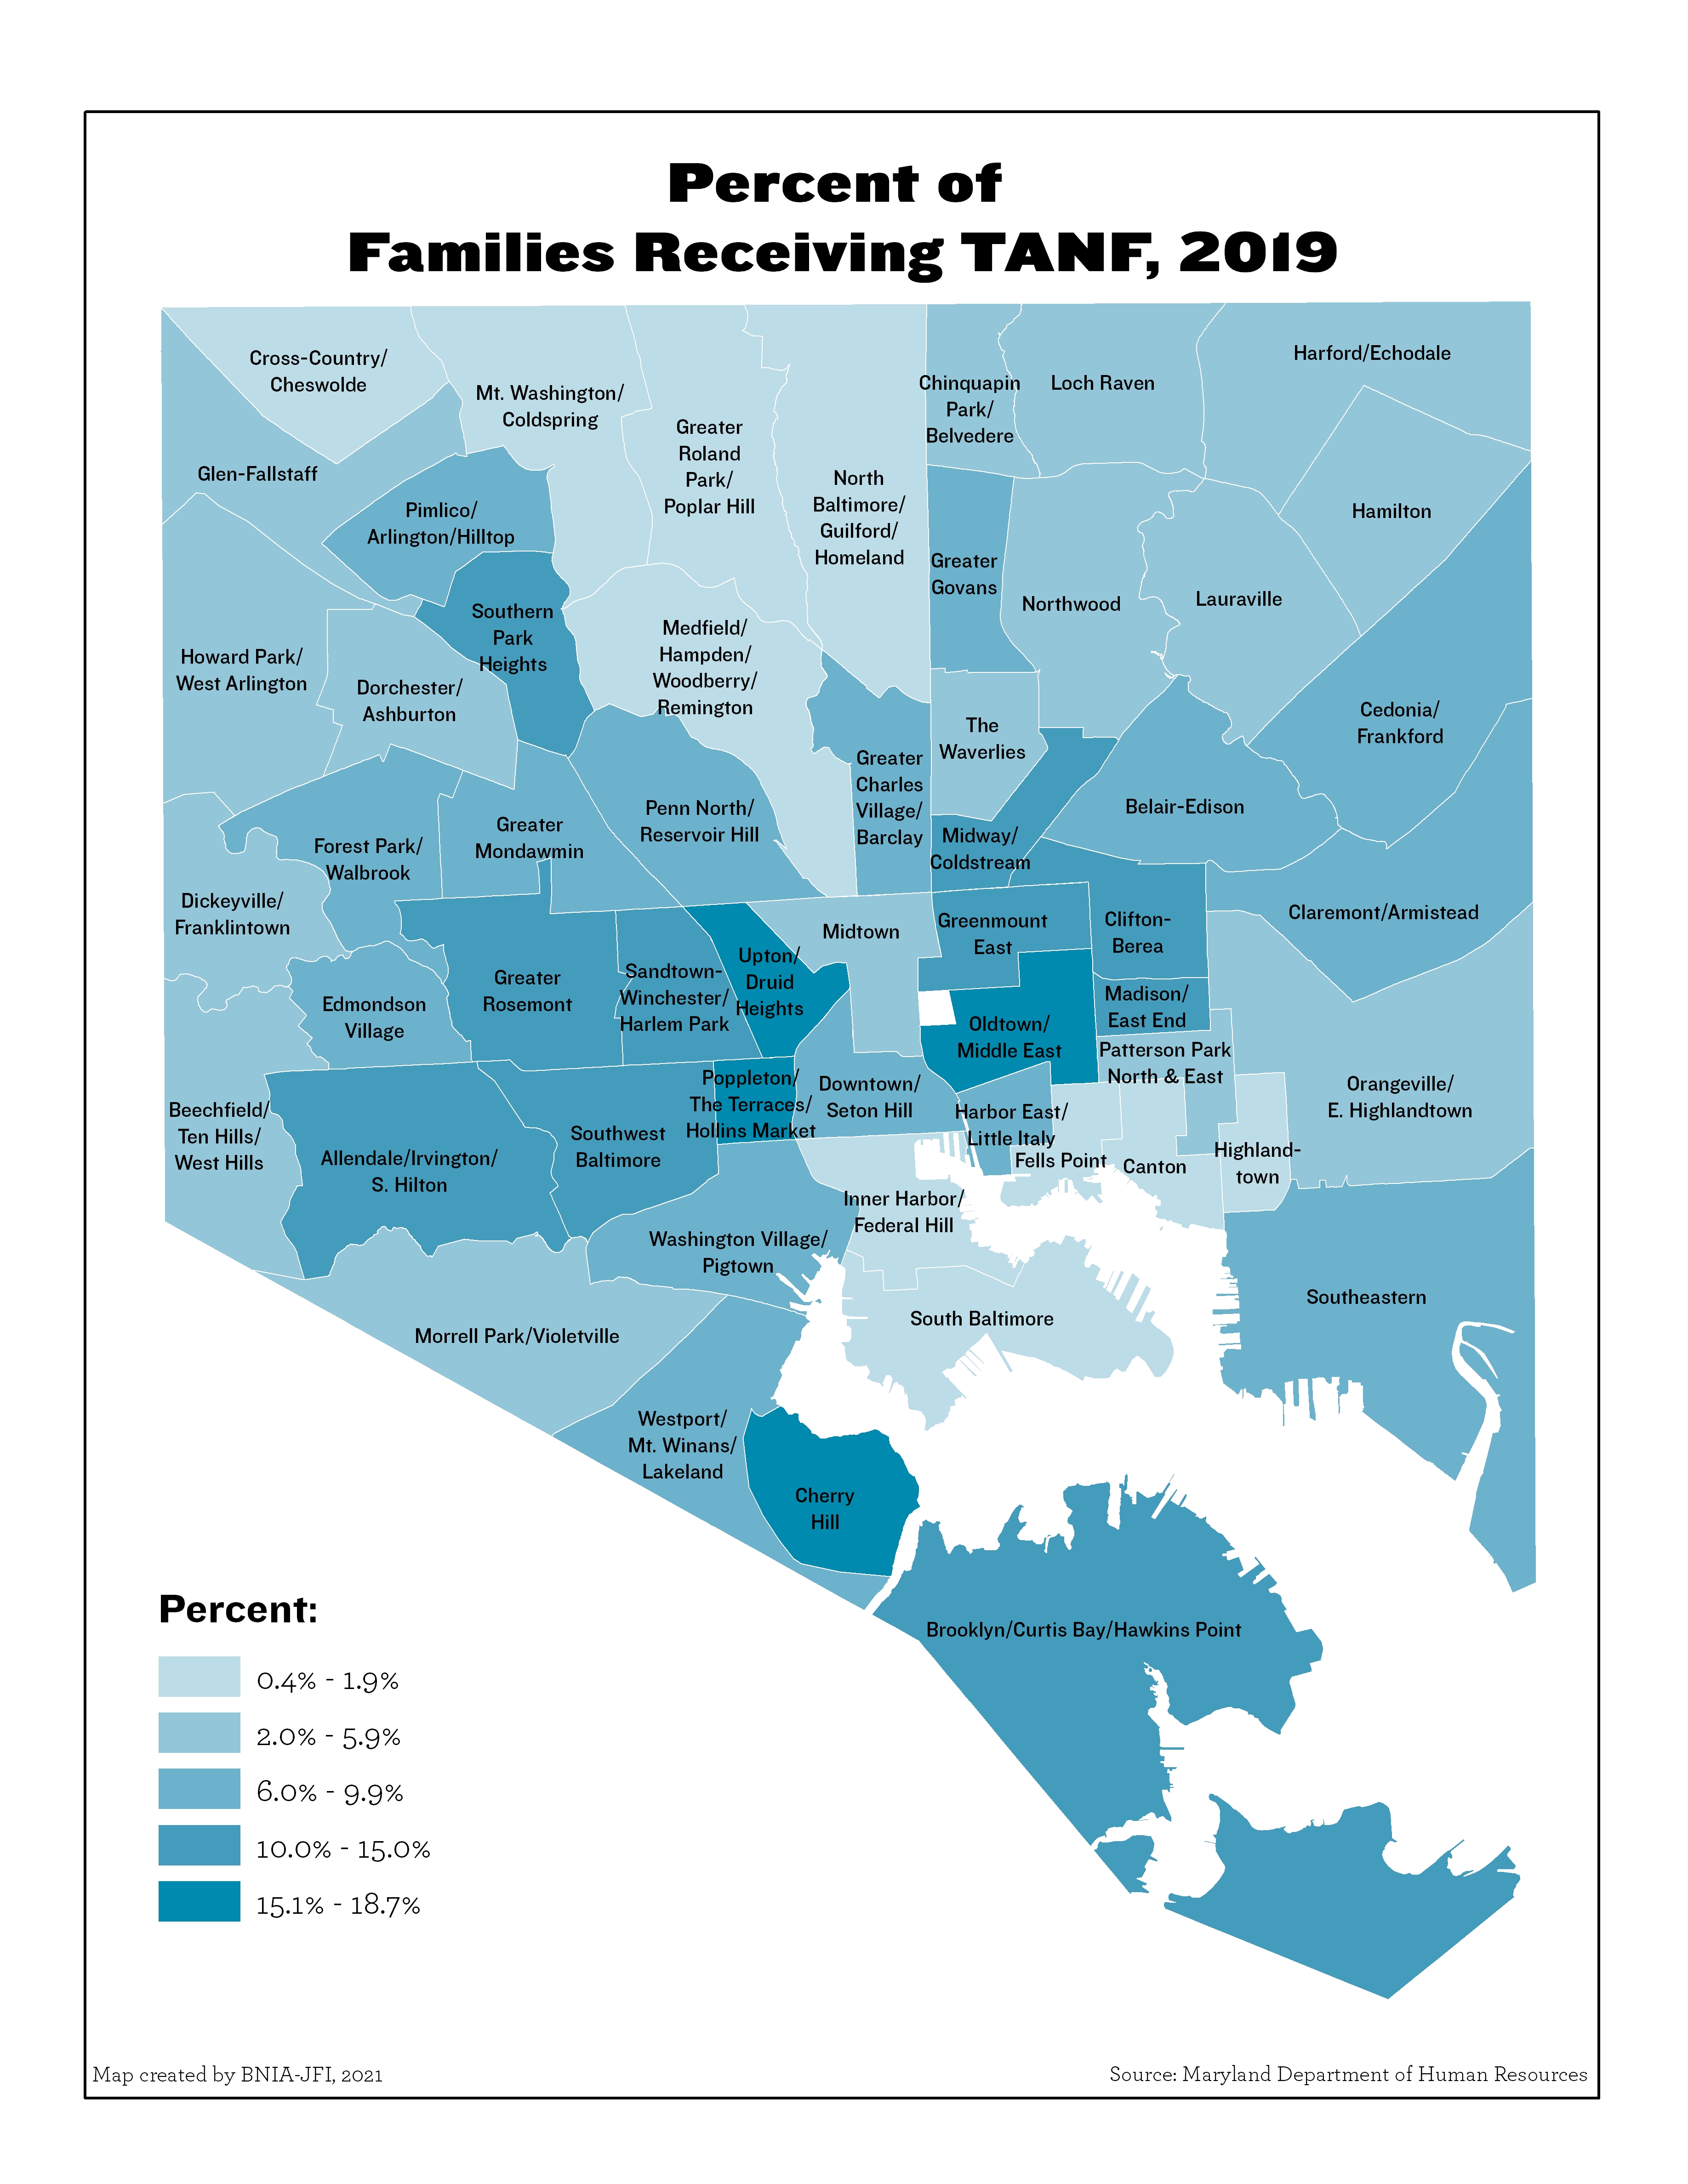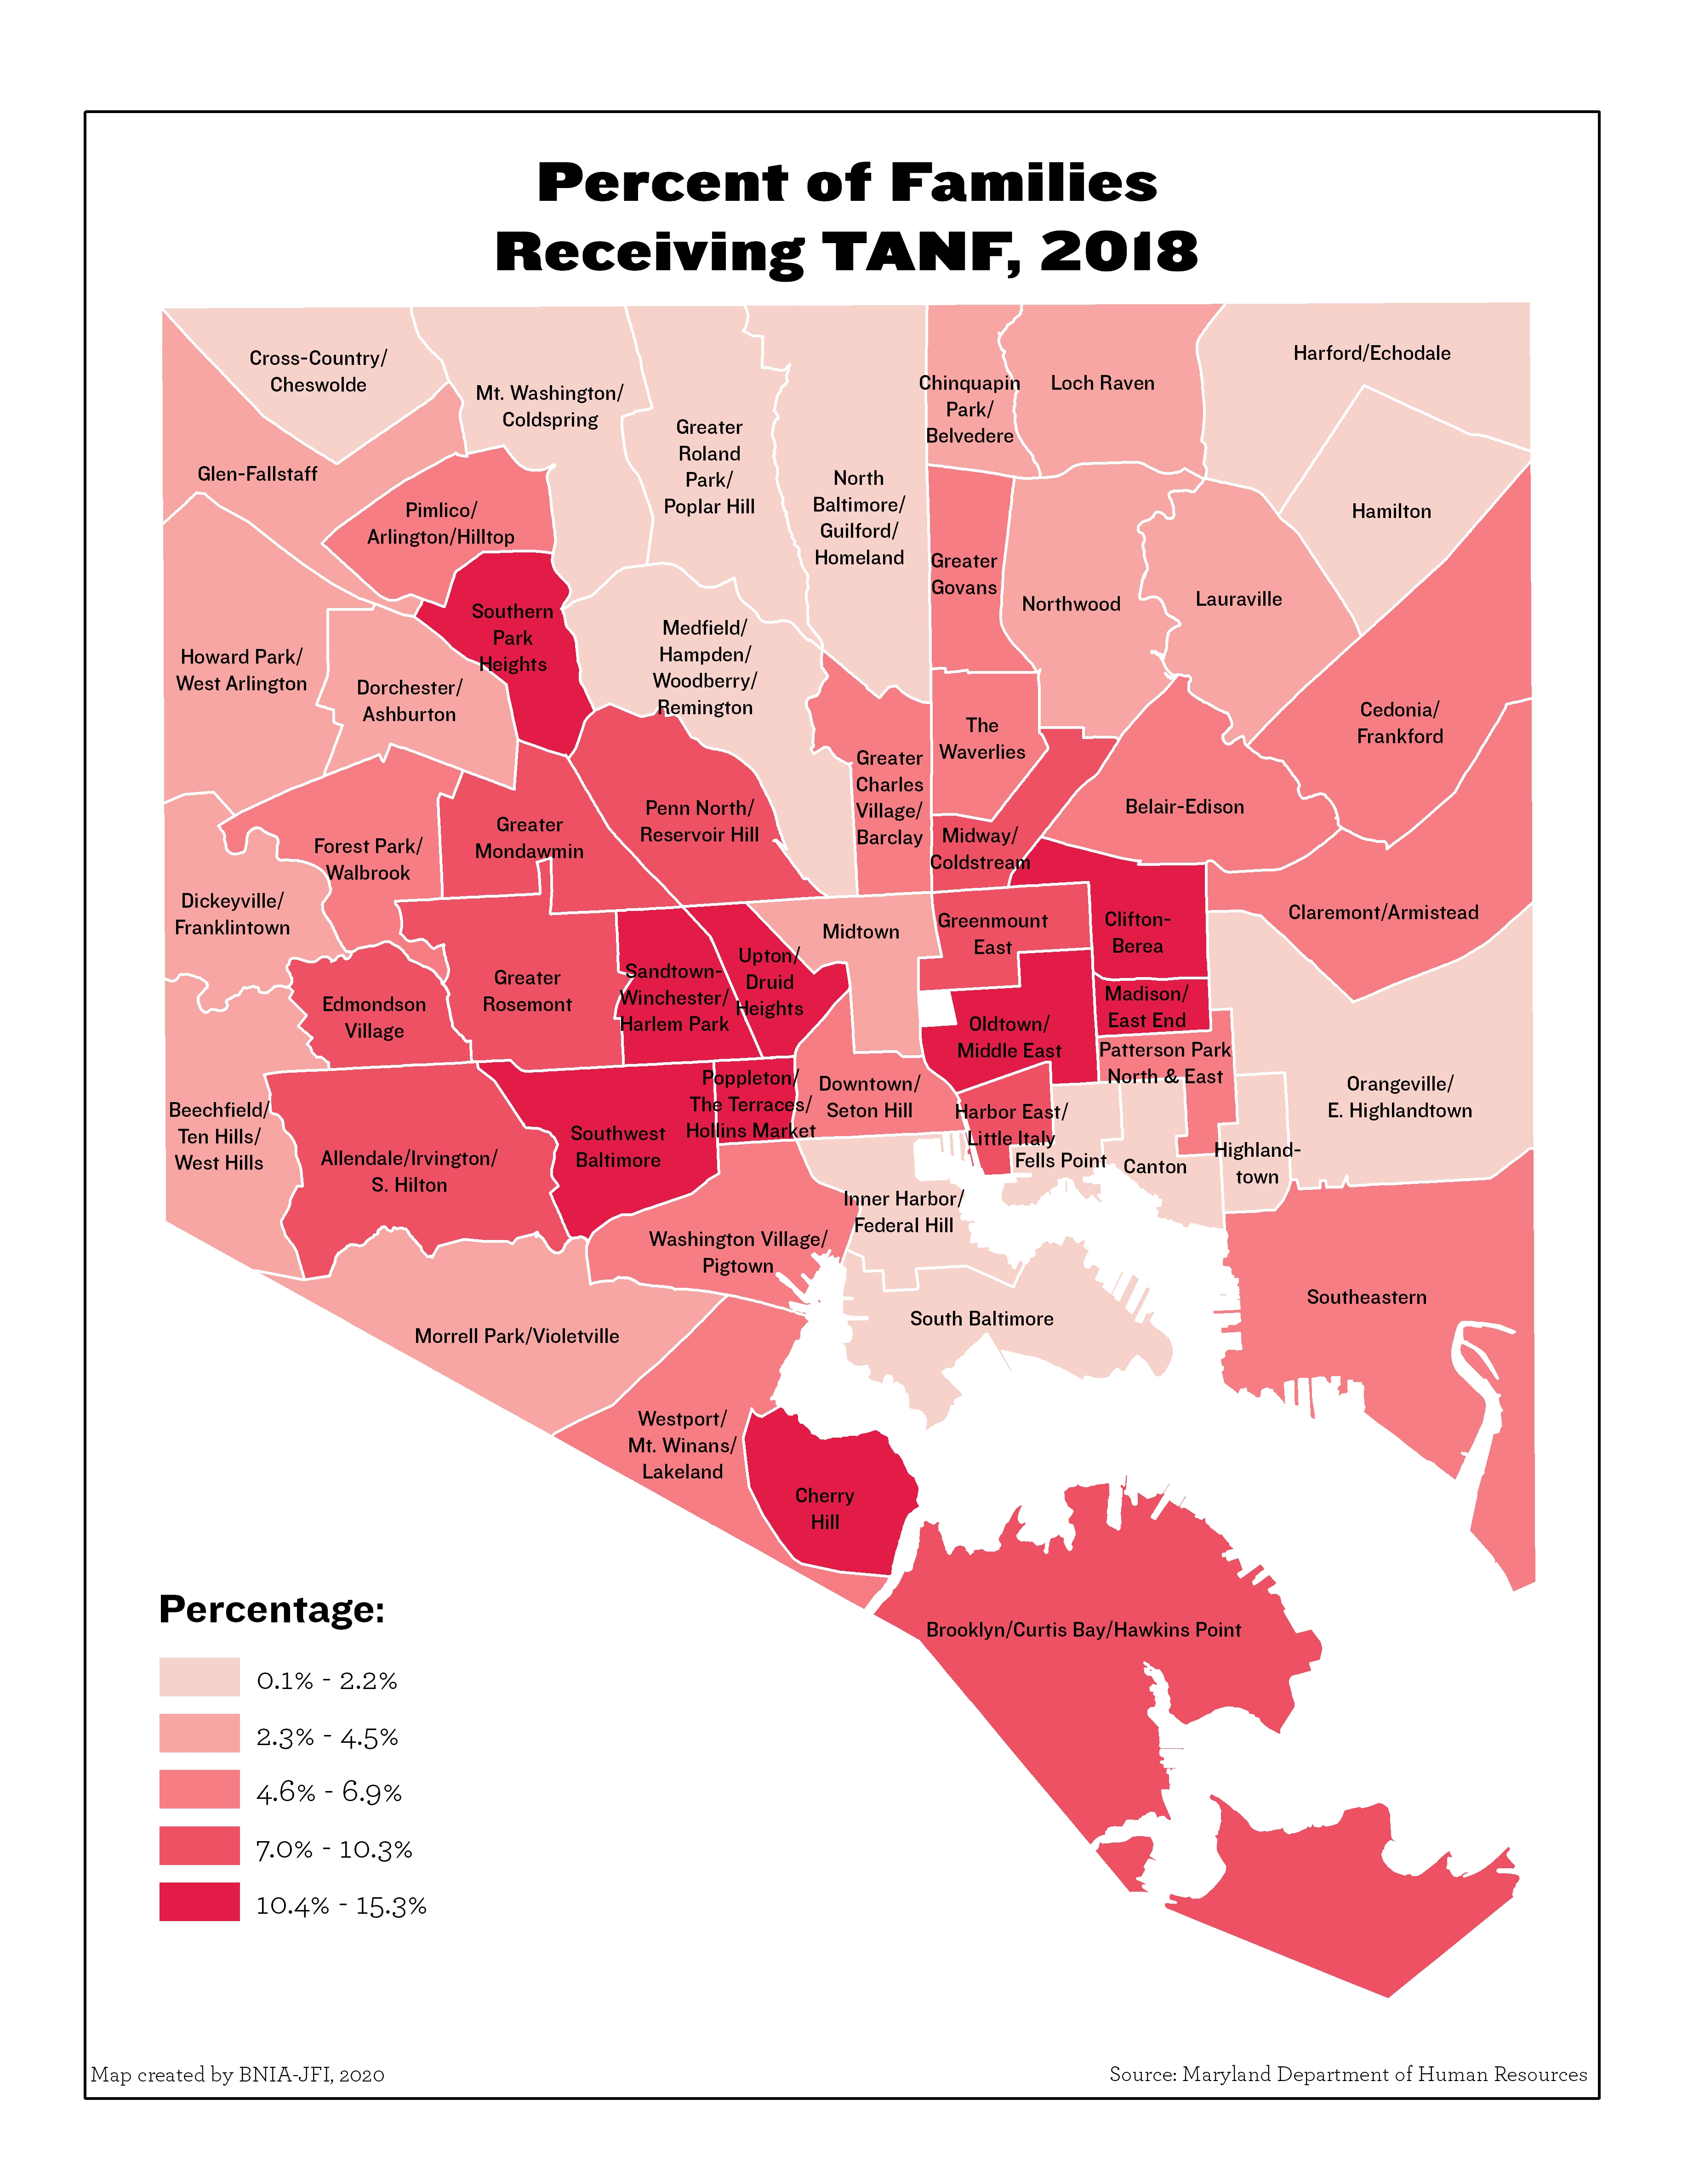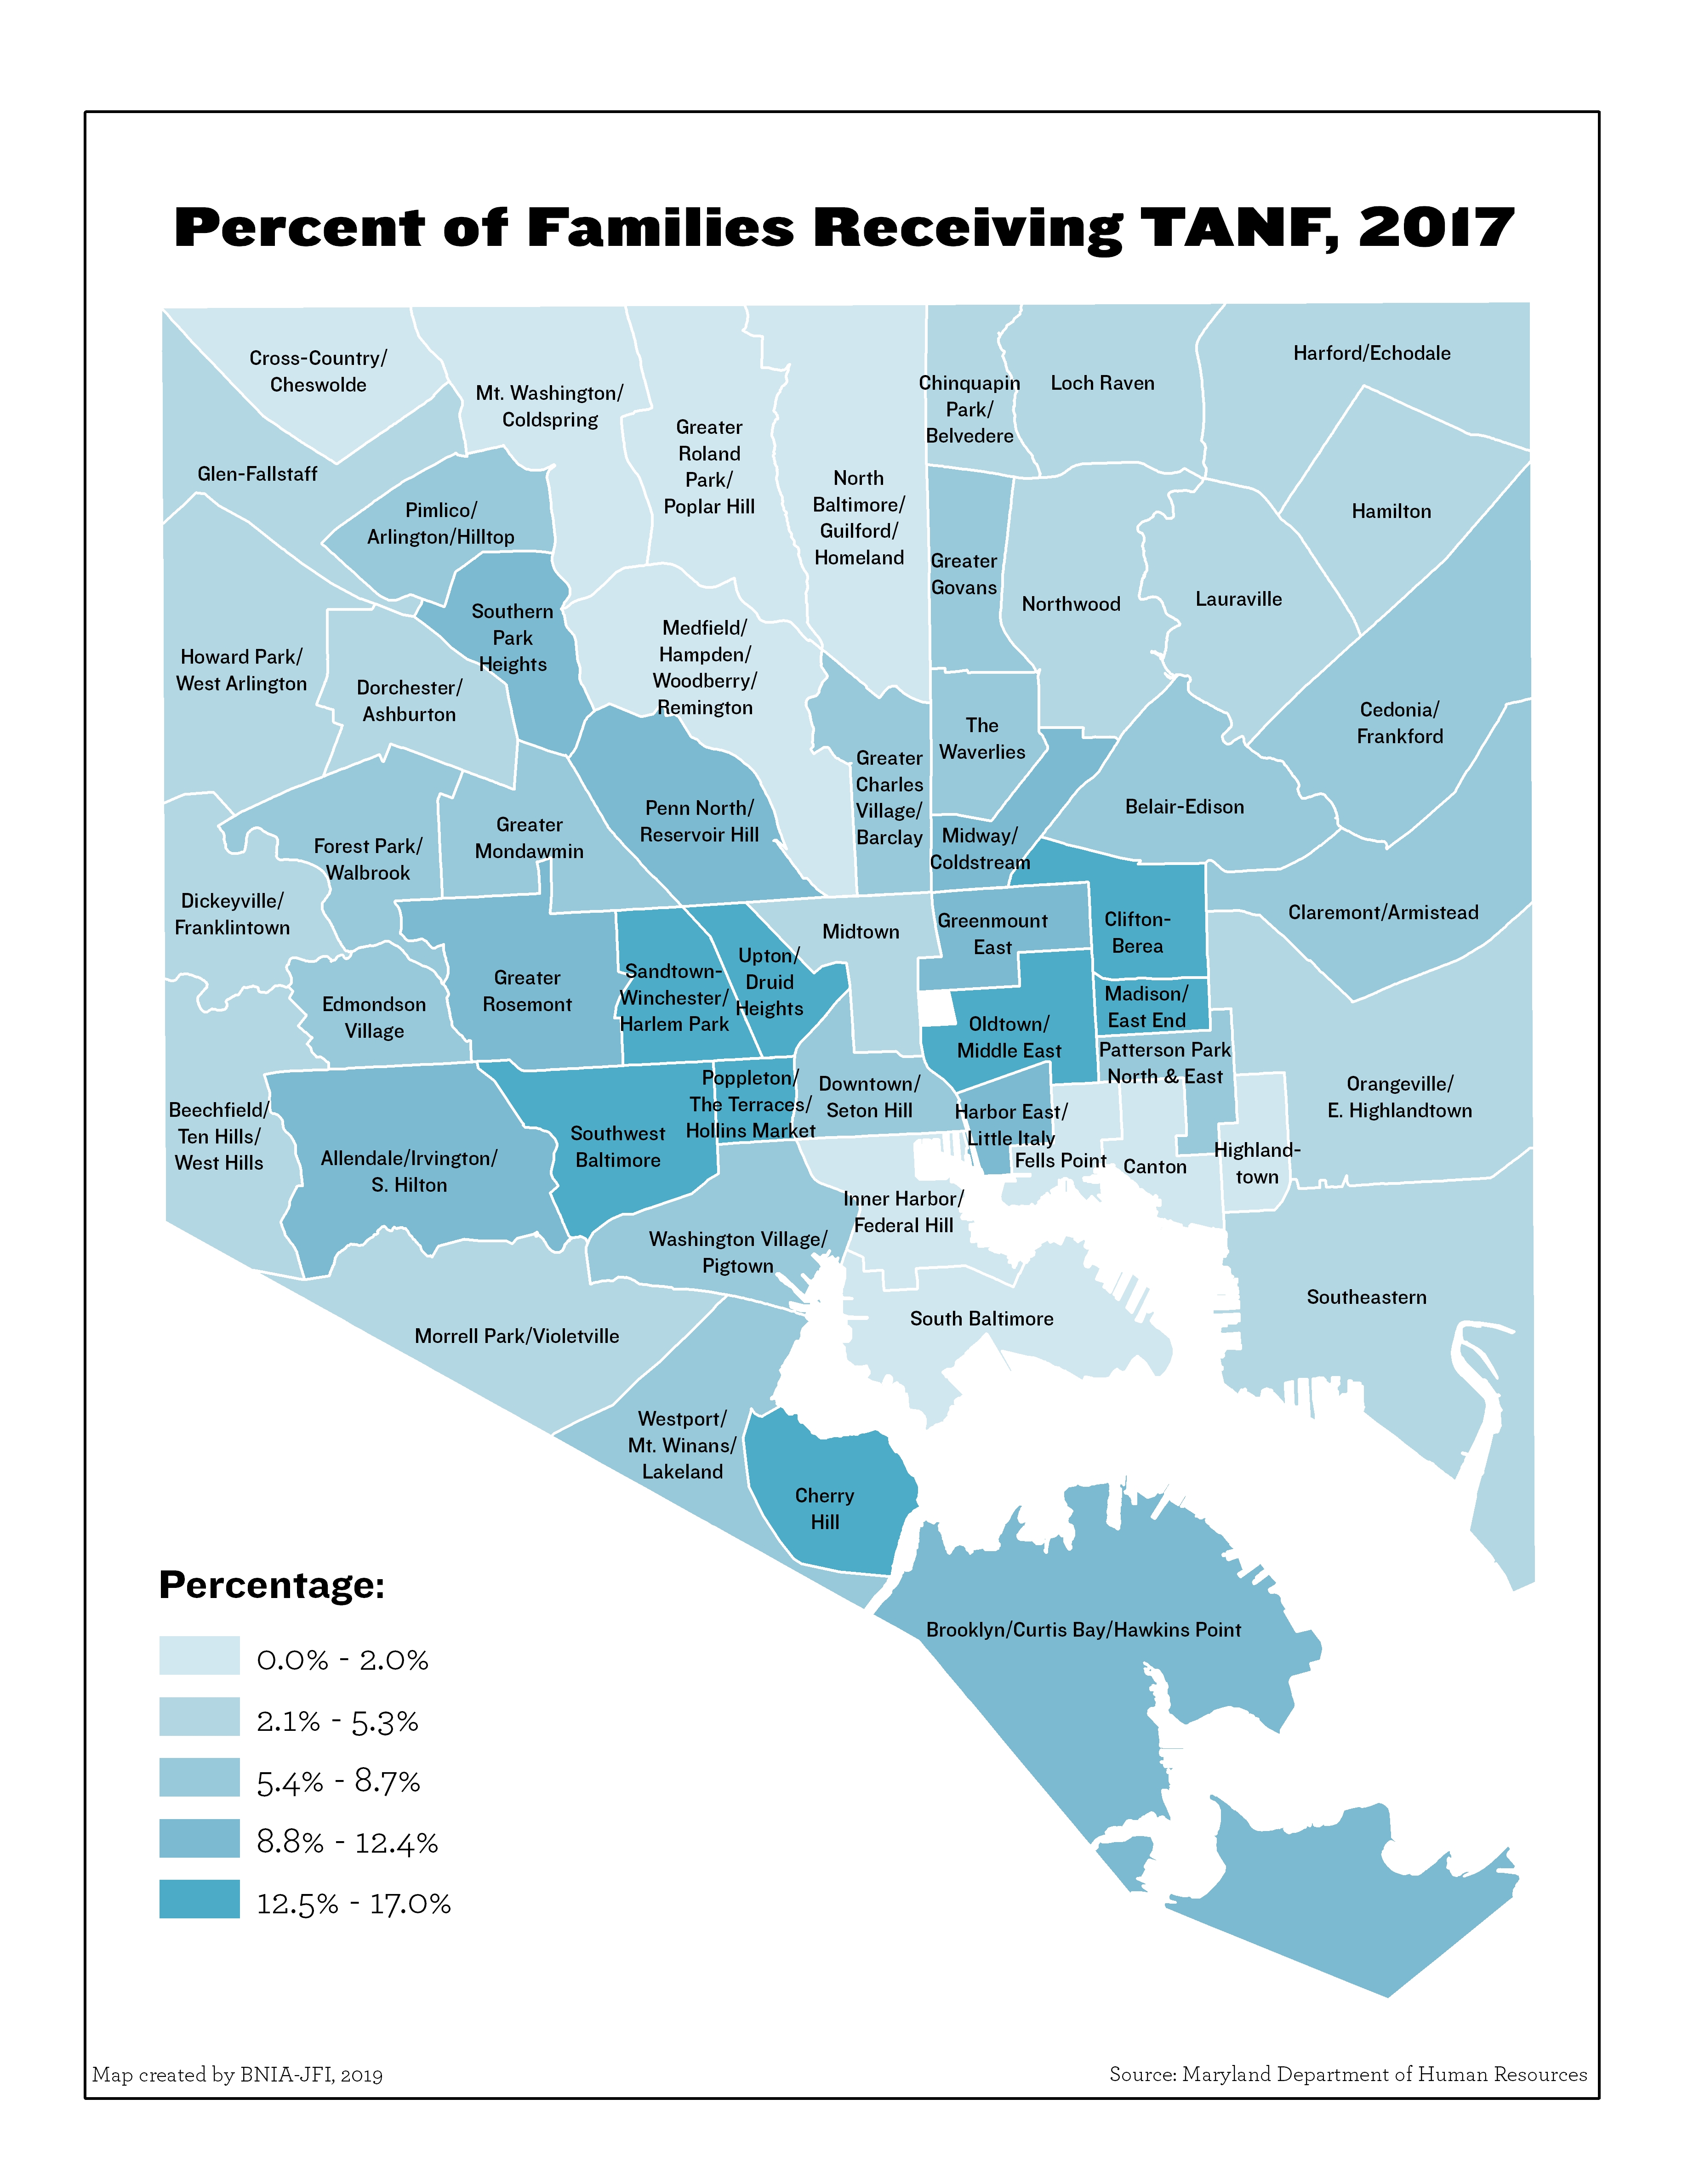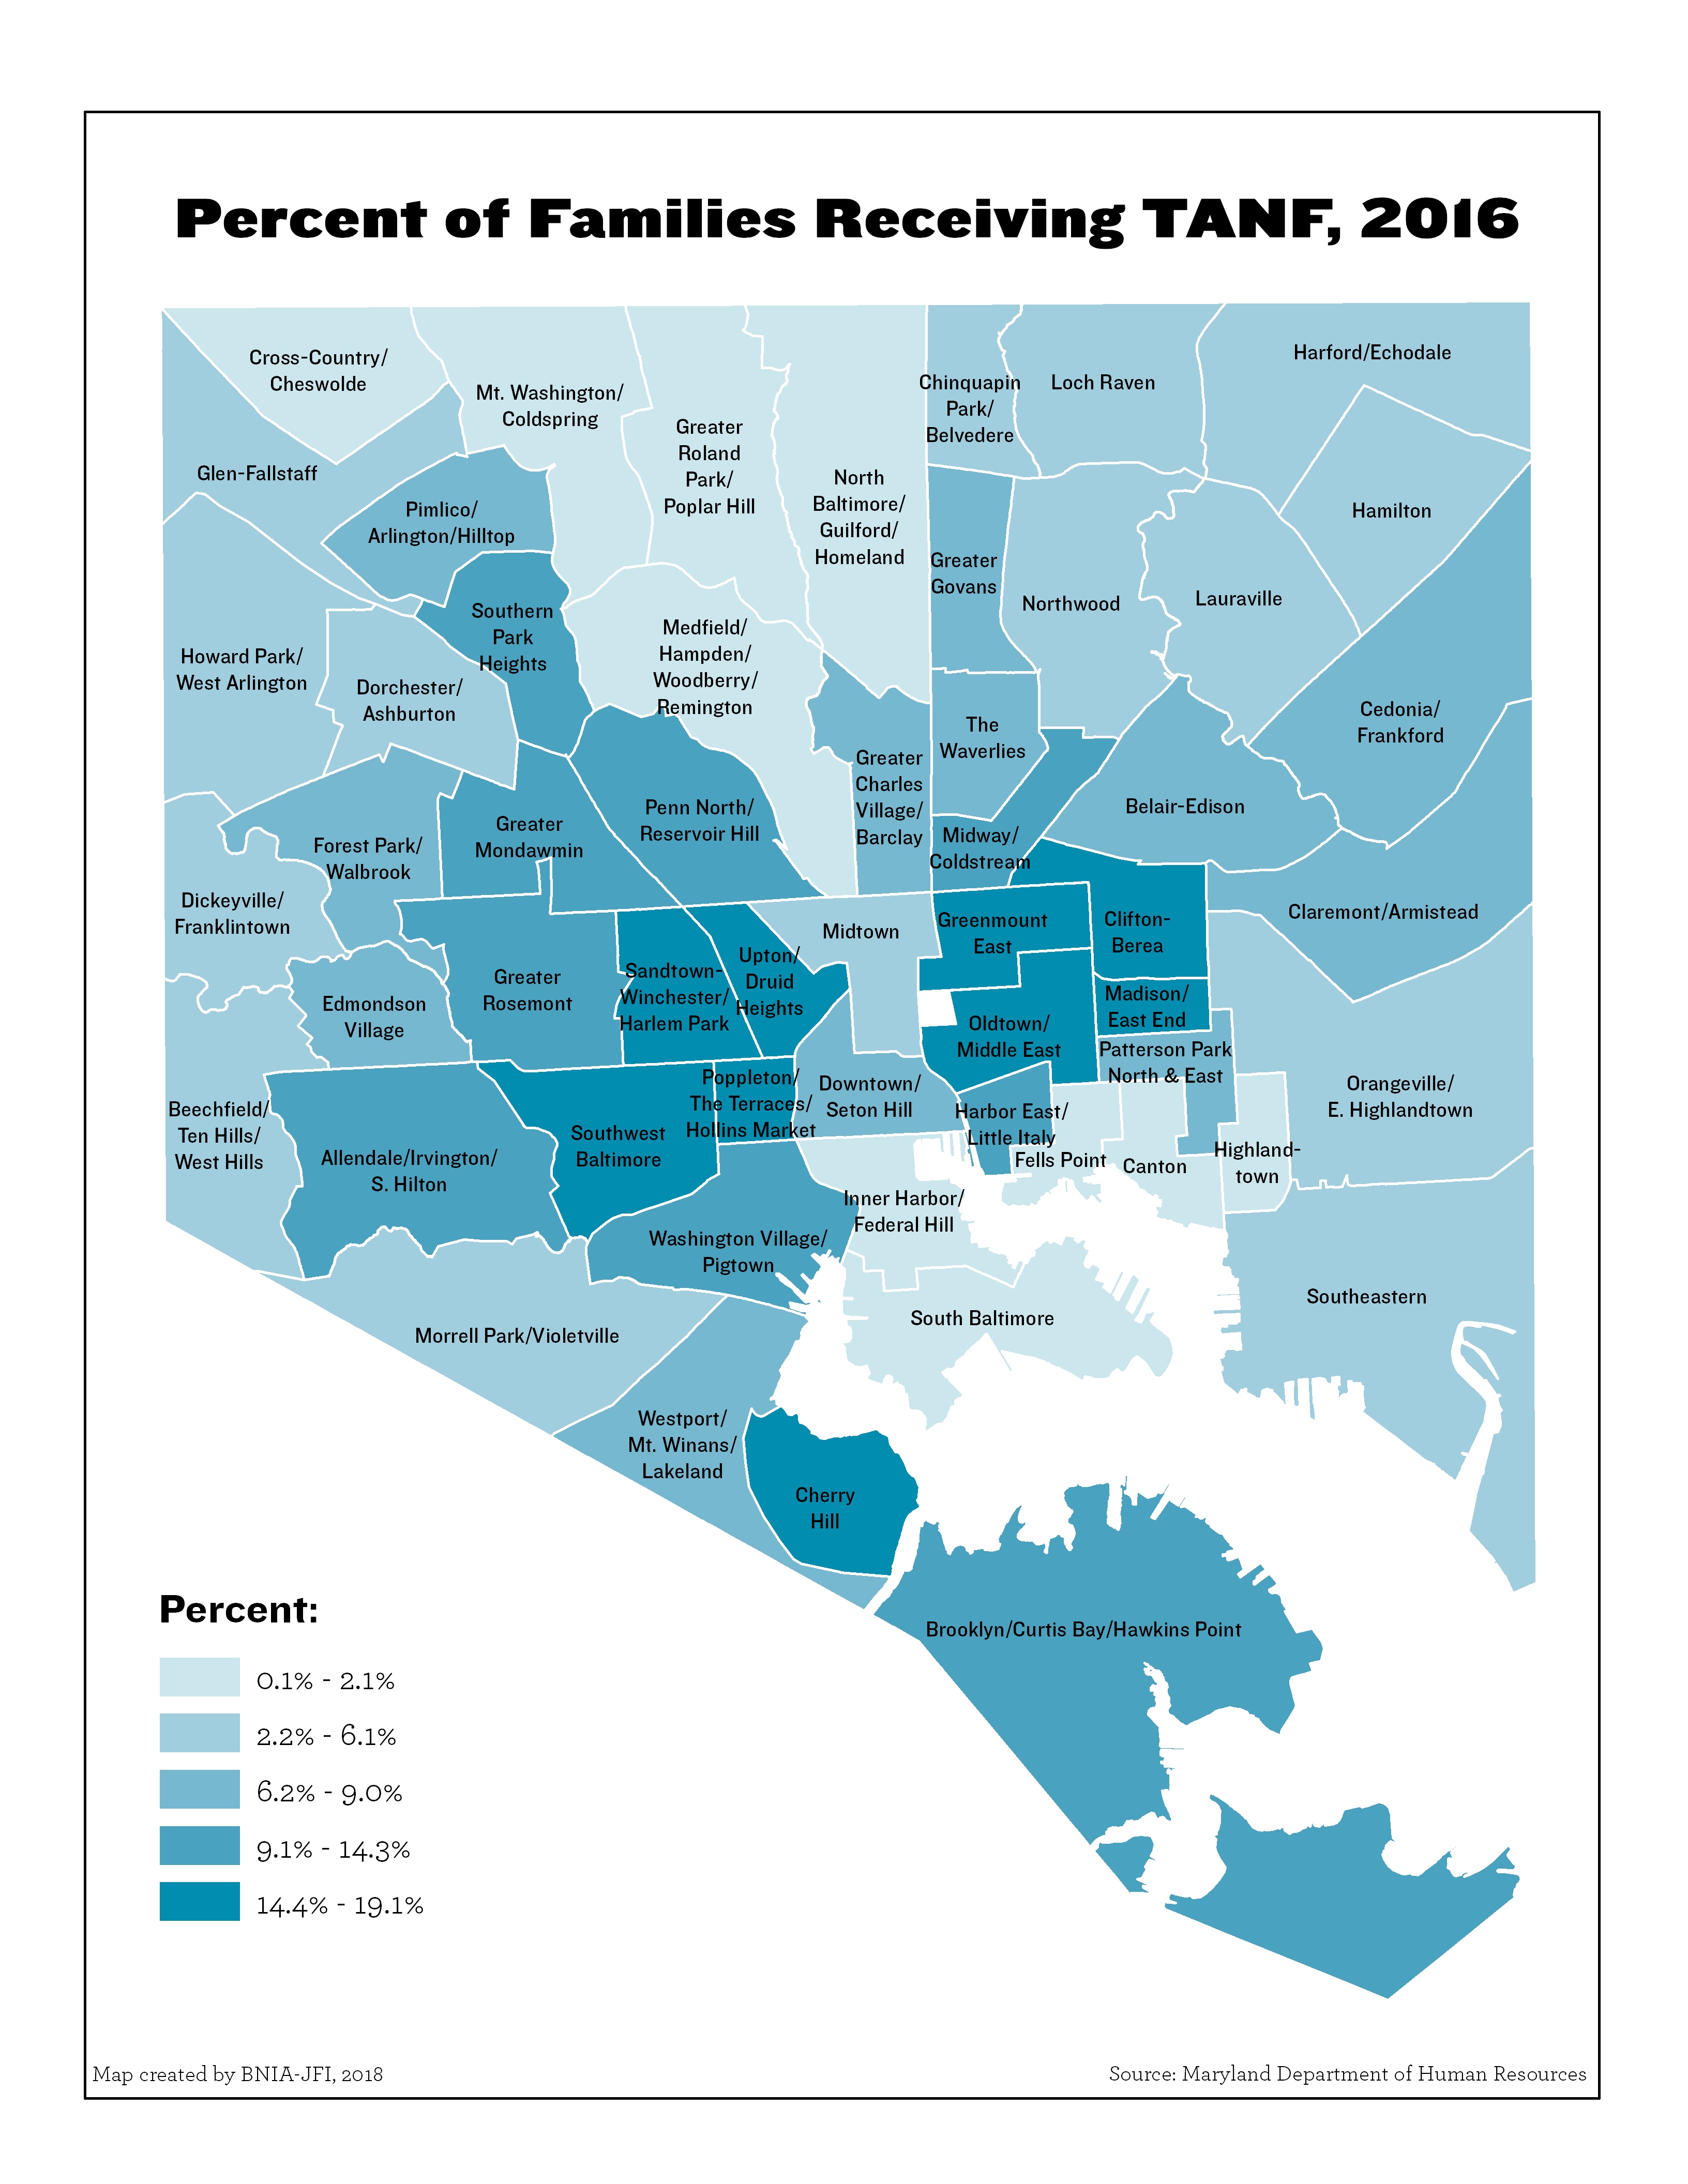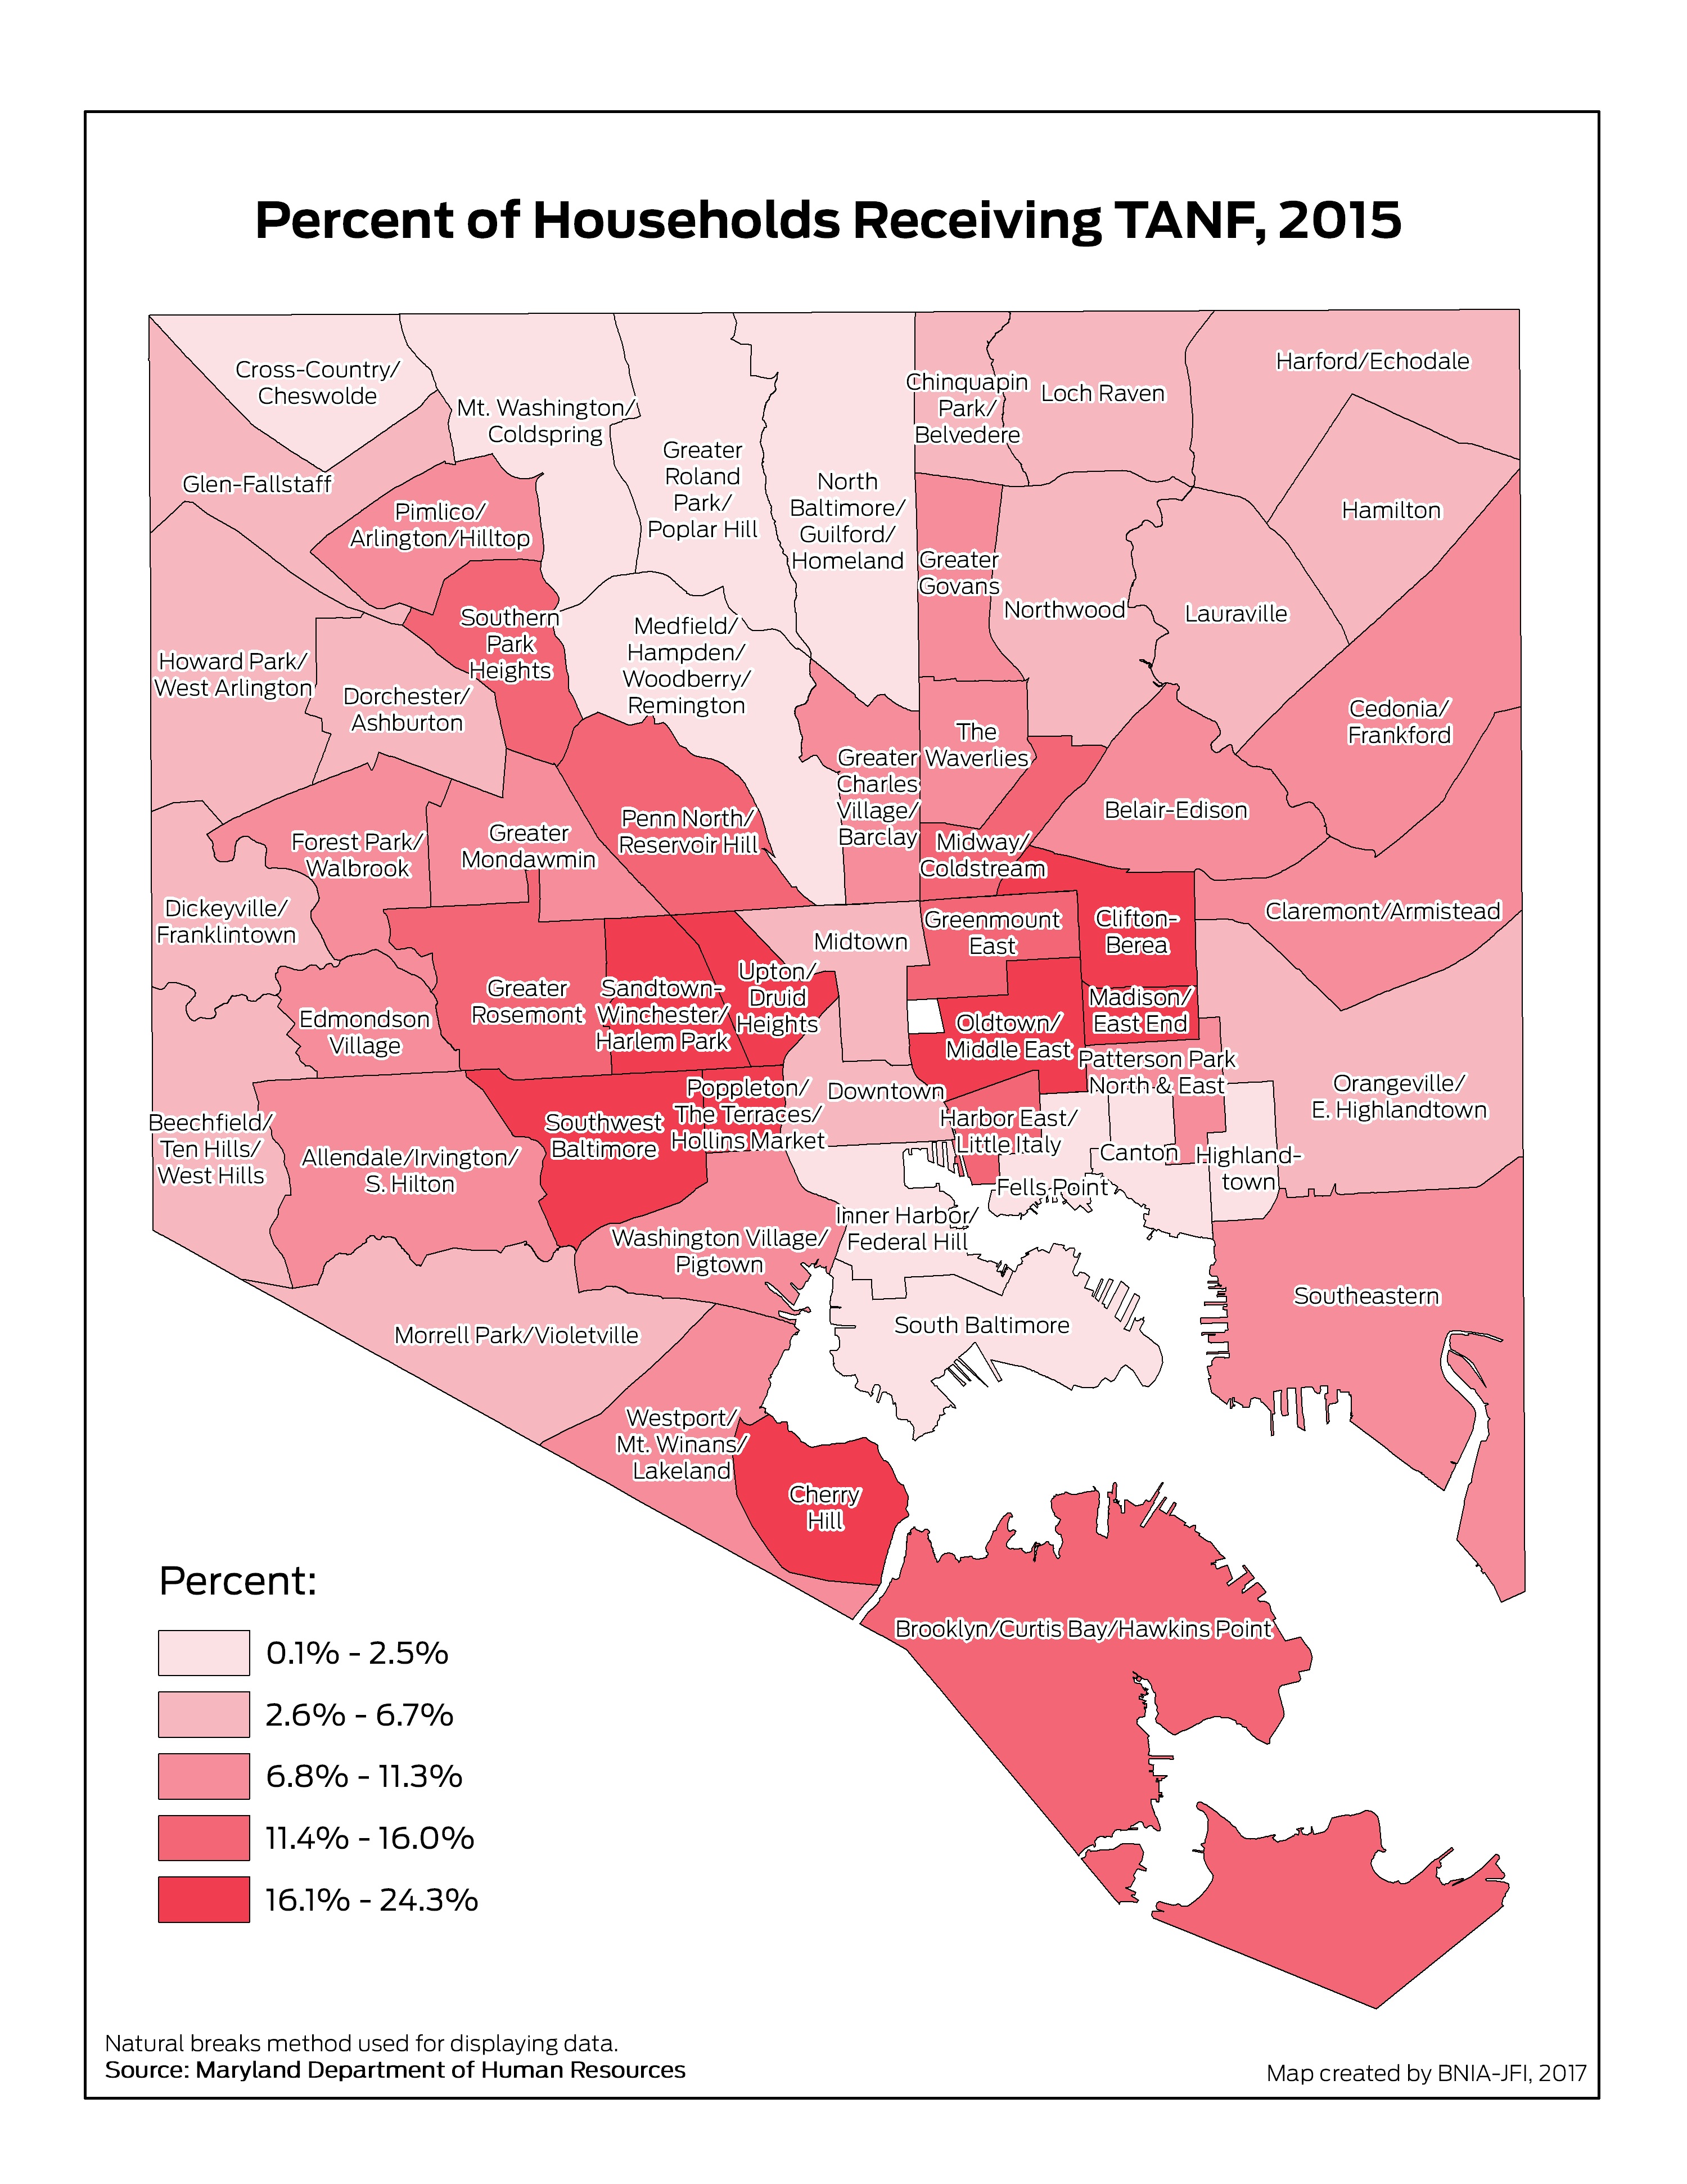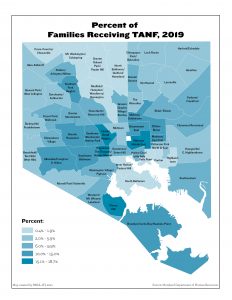
Percent of Families Receiving TANF
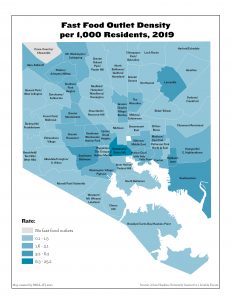
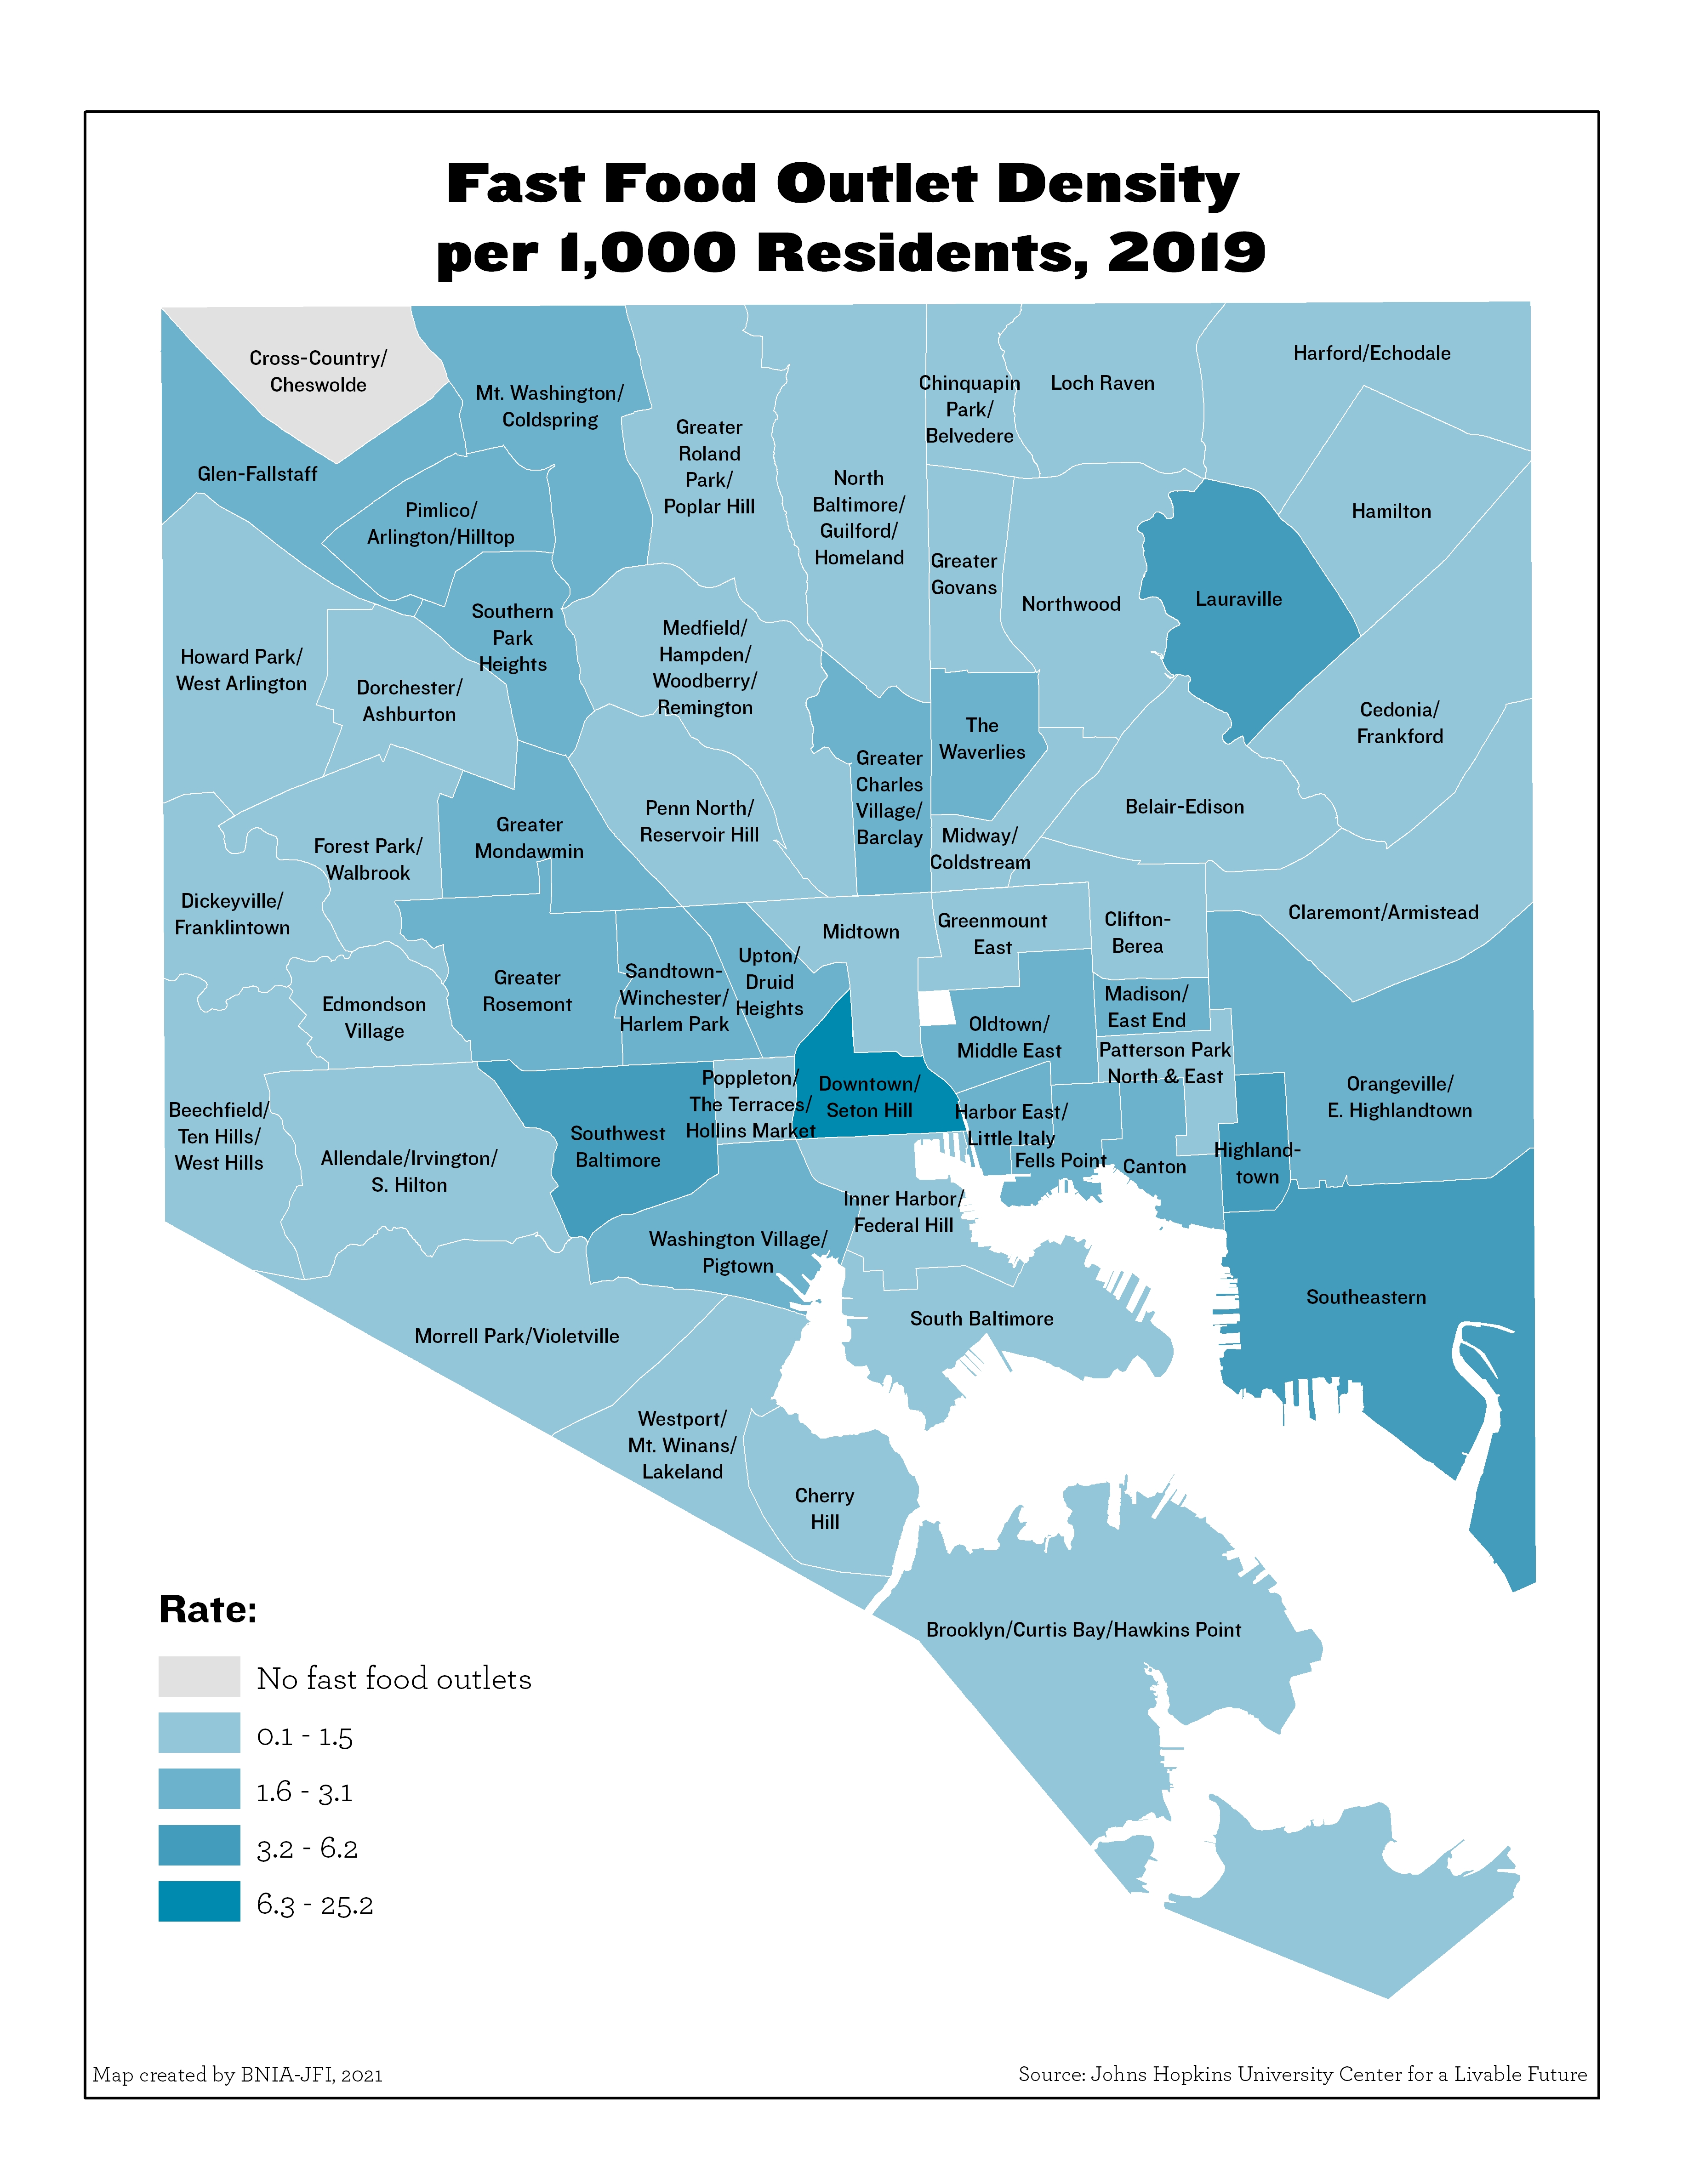
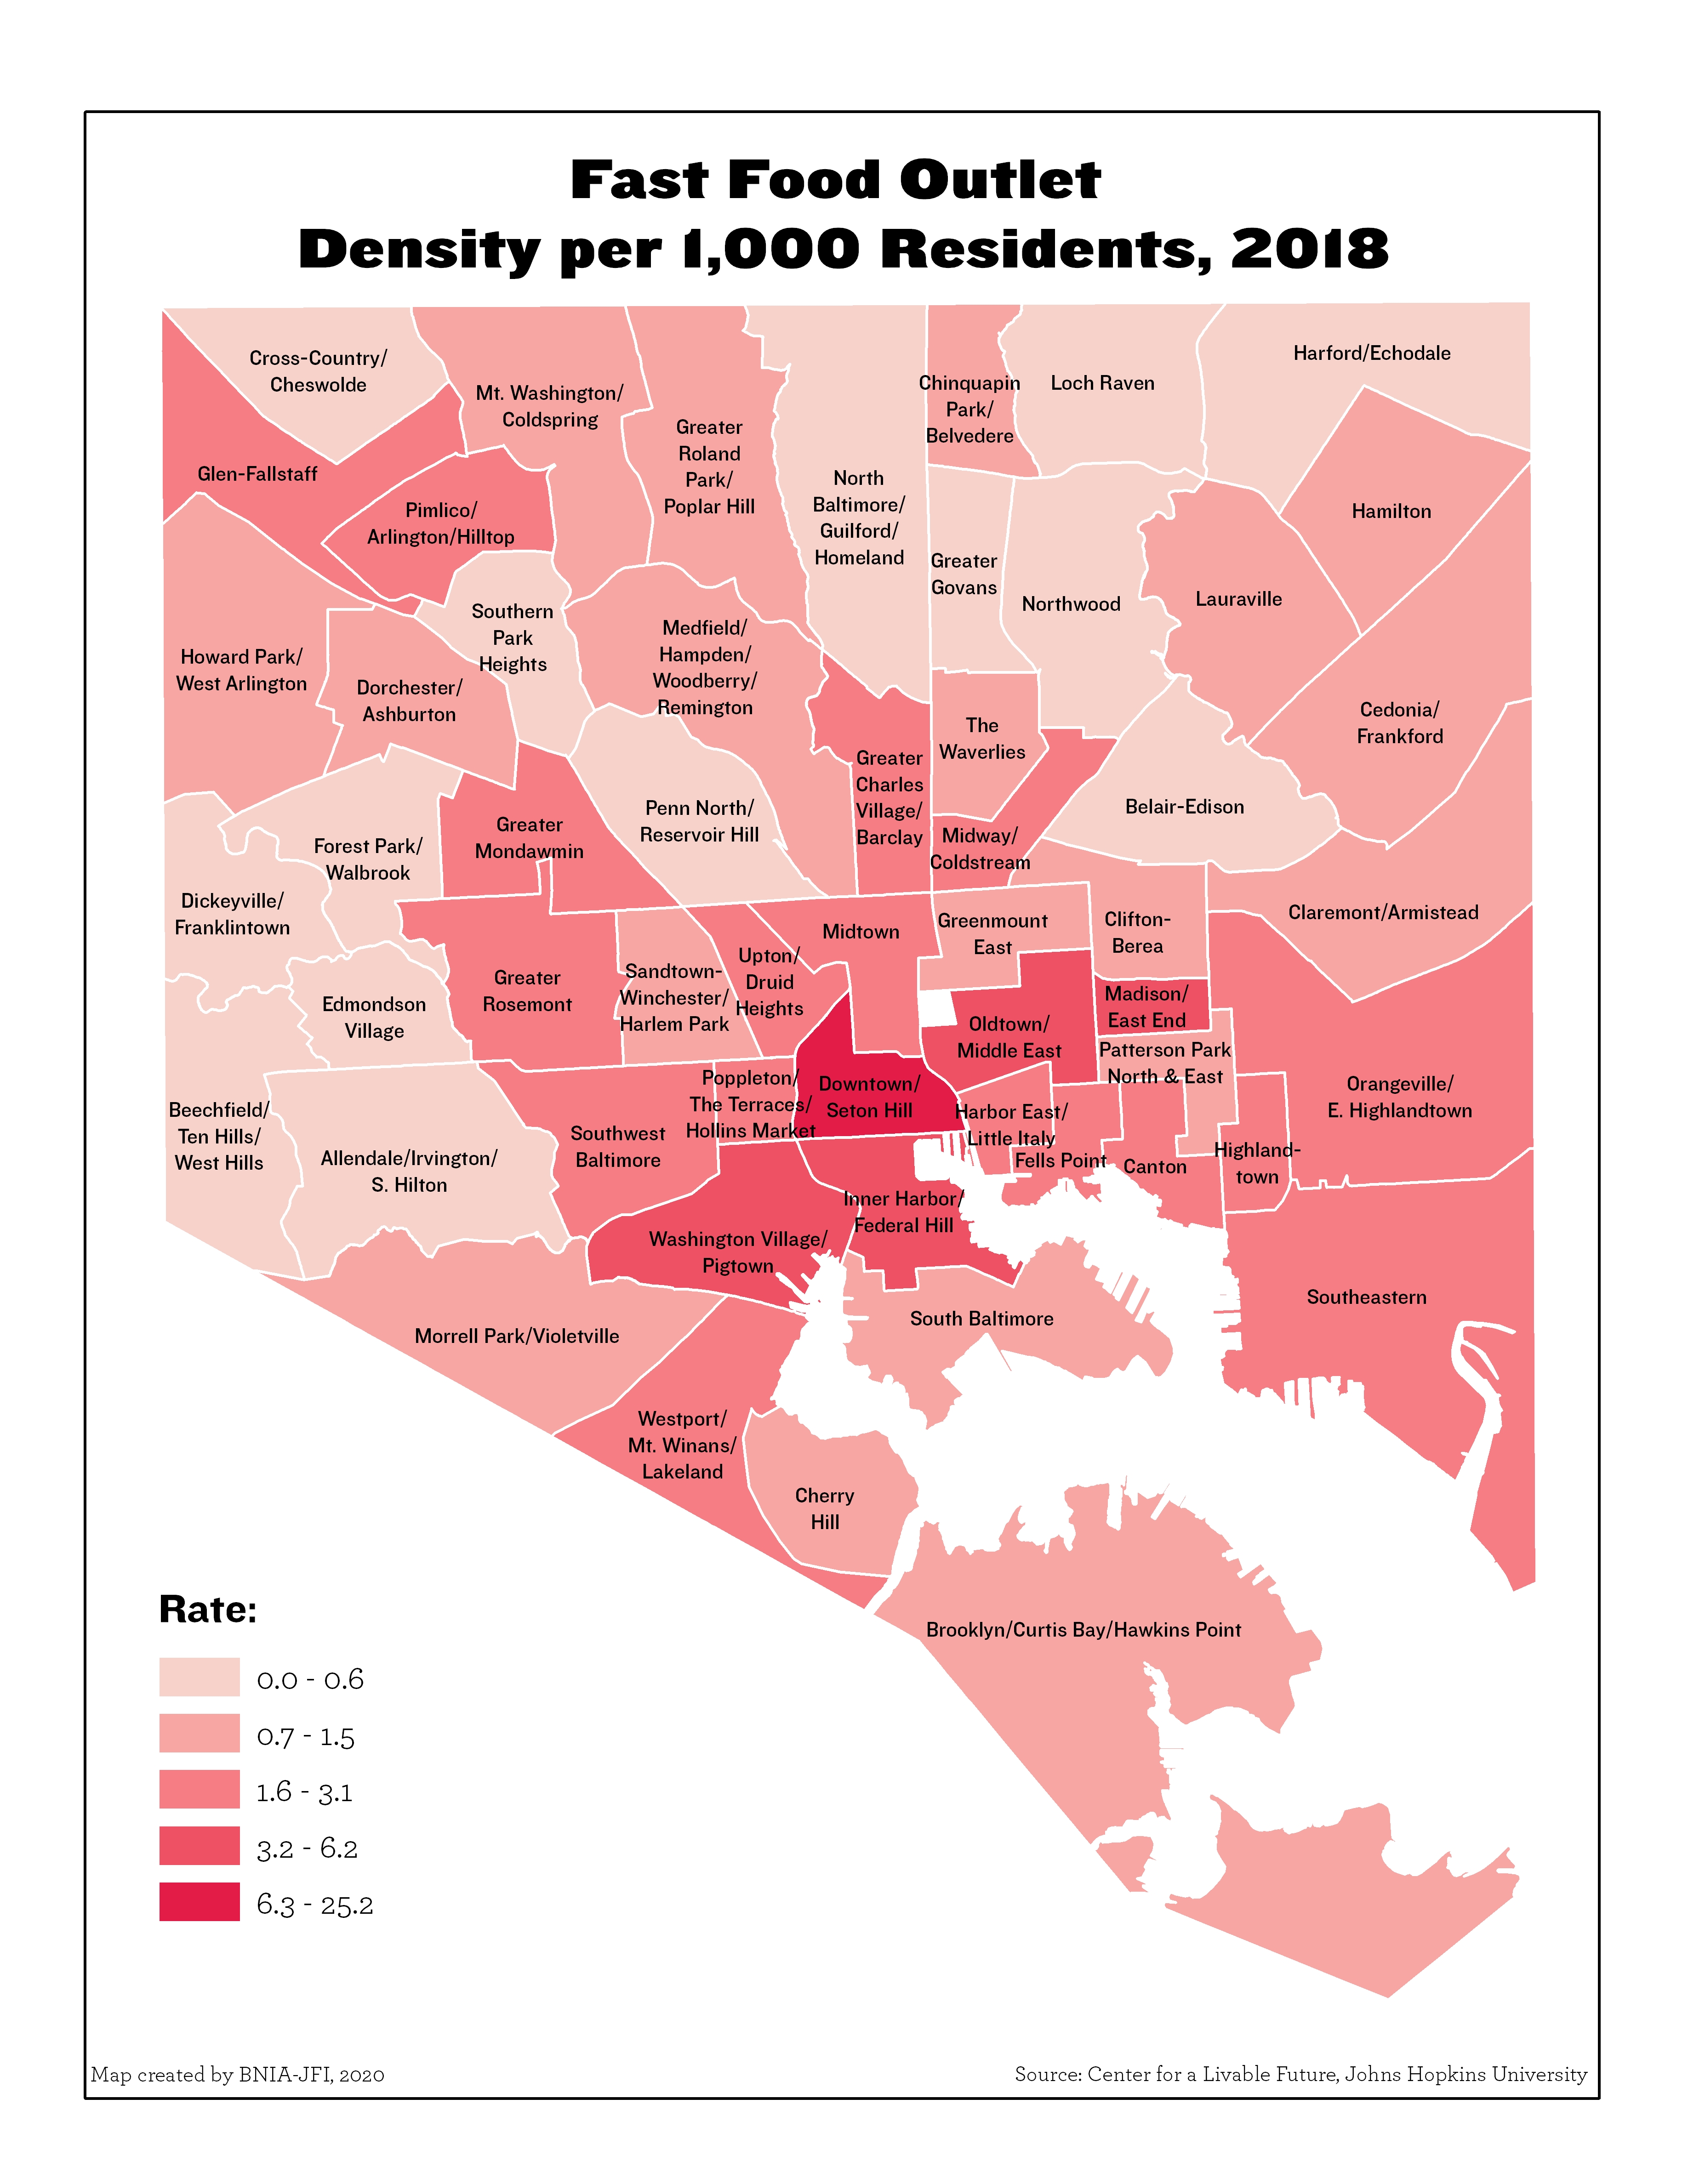
Fast Food Outlet Density per 1,000 Residents
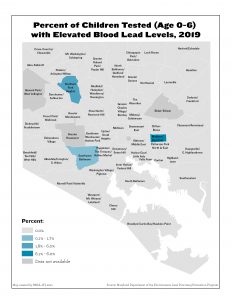
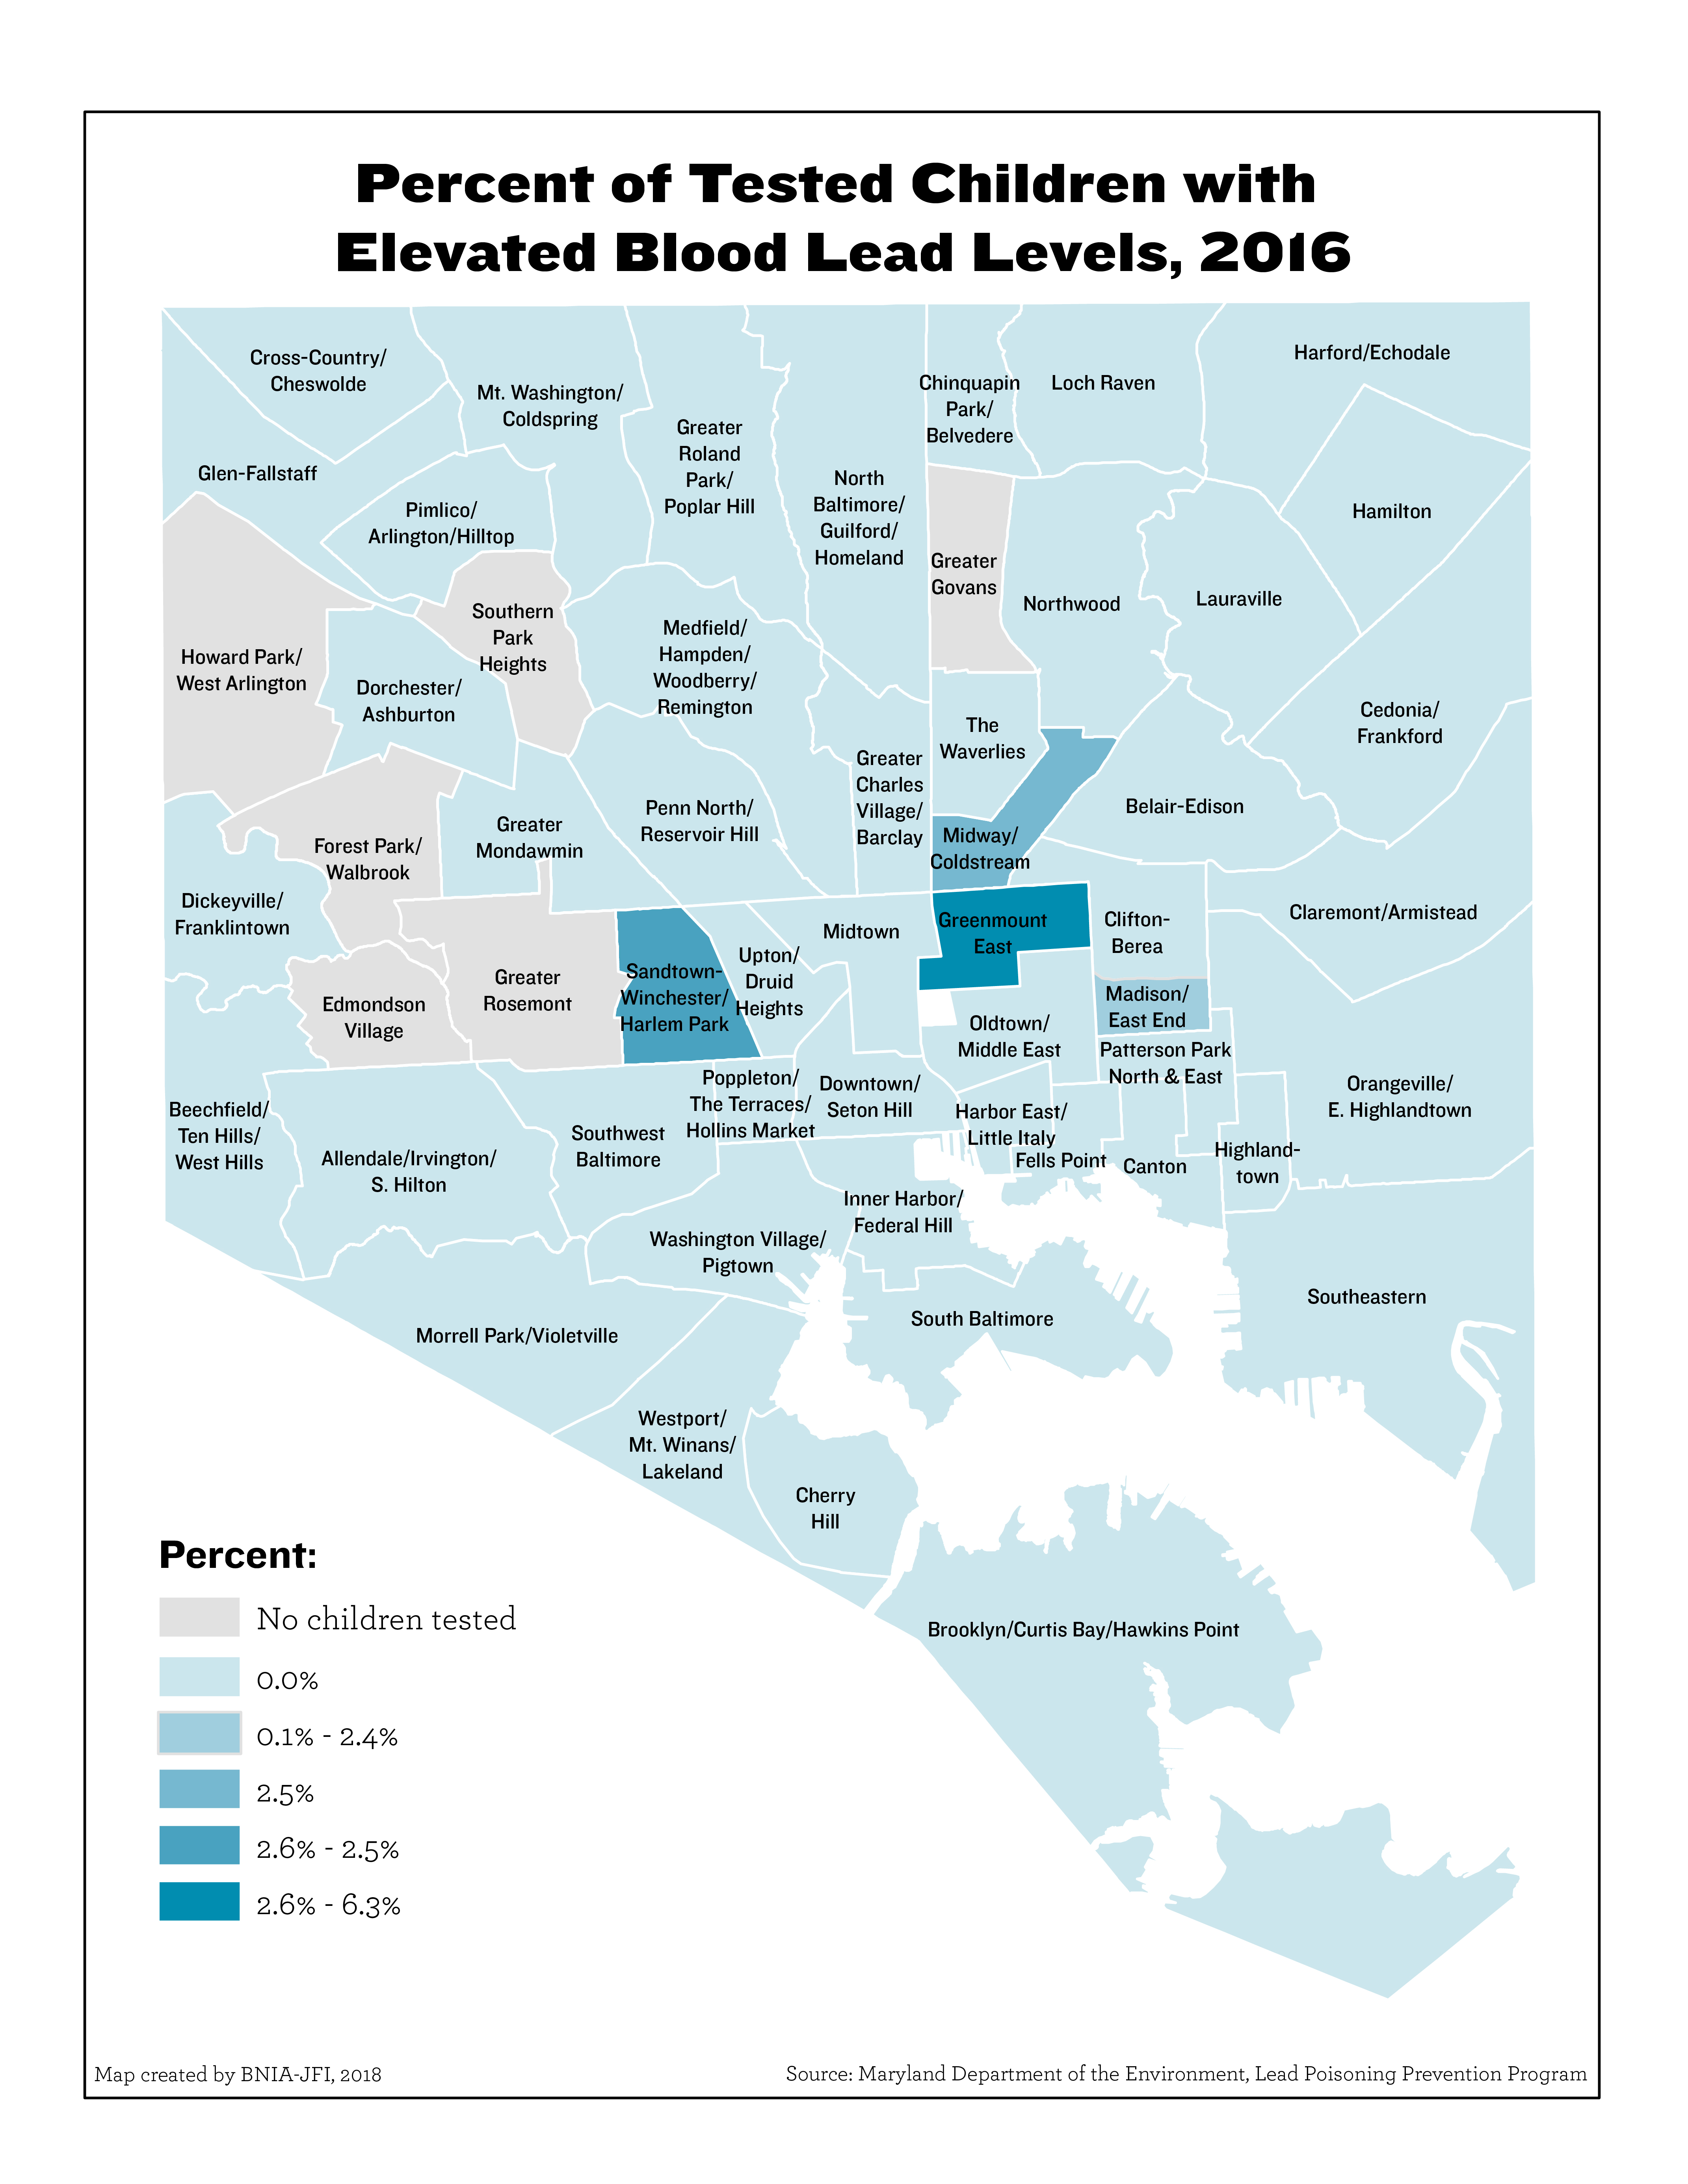
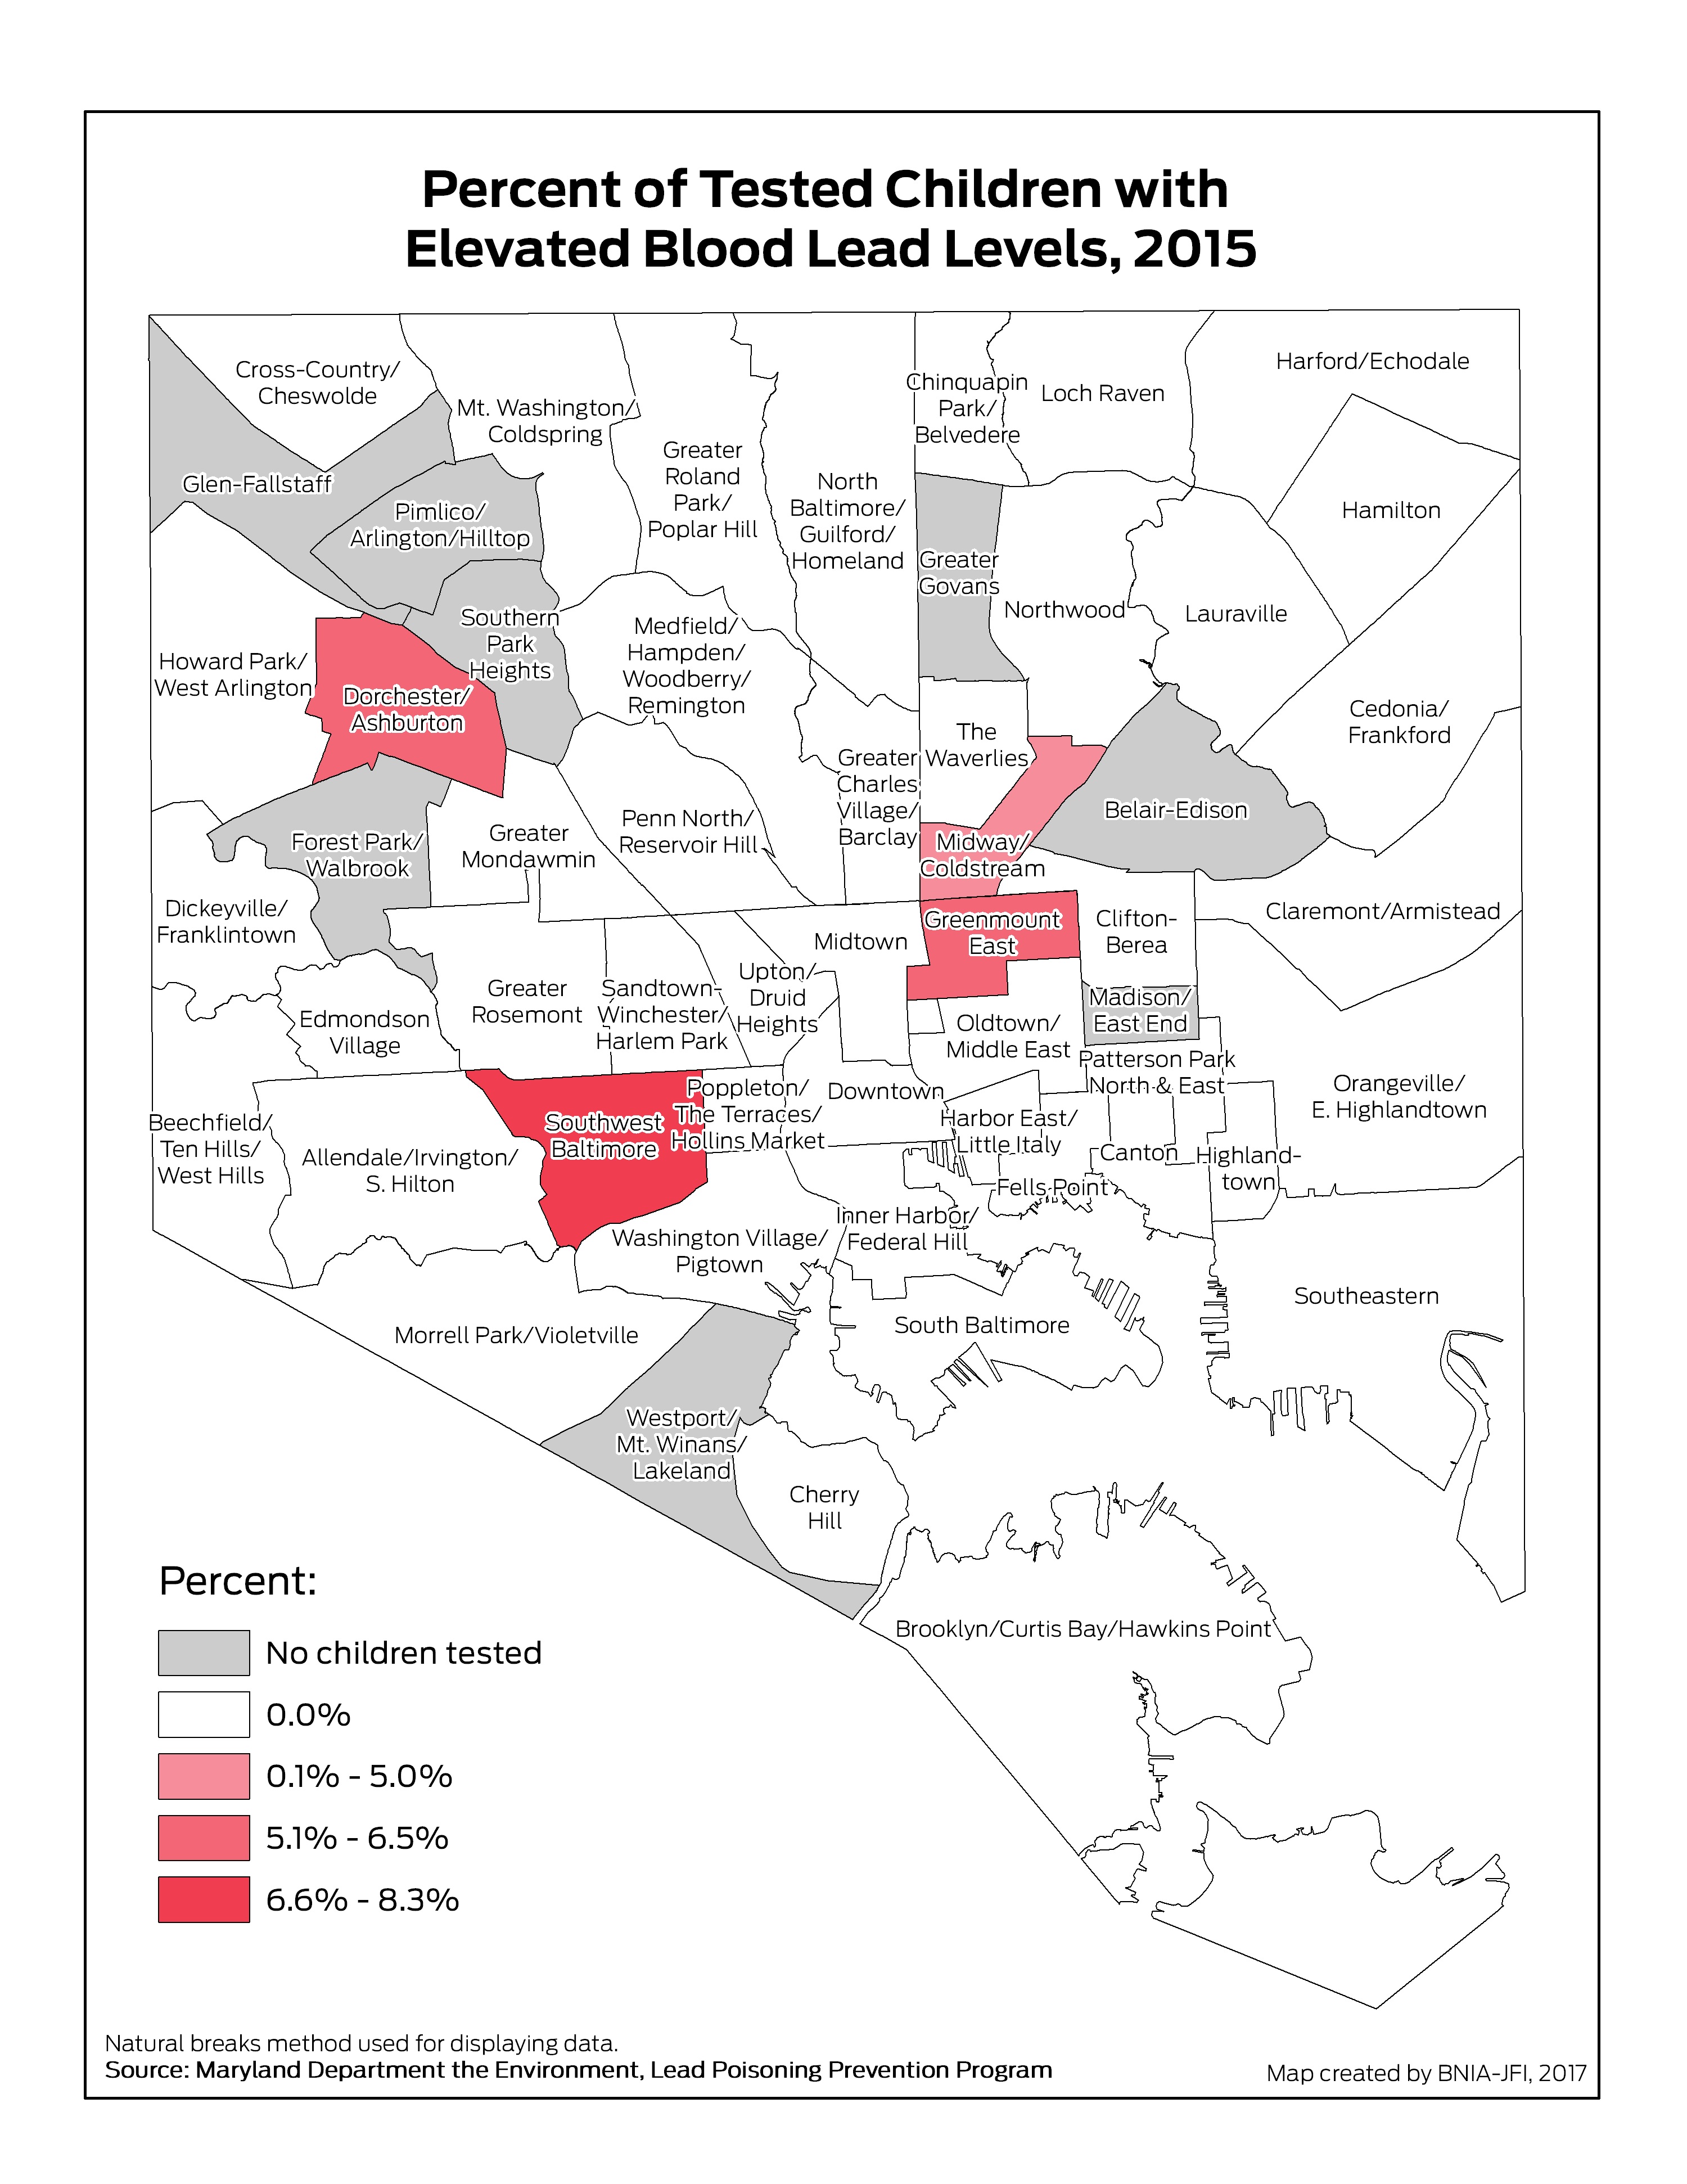
Percent of Children Tested (Age 0-6) with Elevated Blood Lead Levels
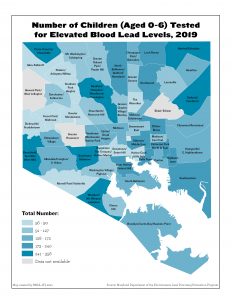
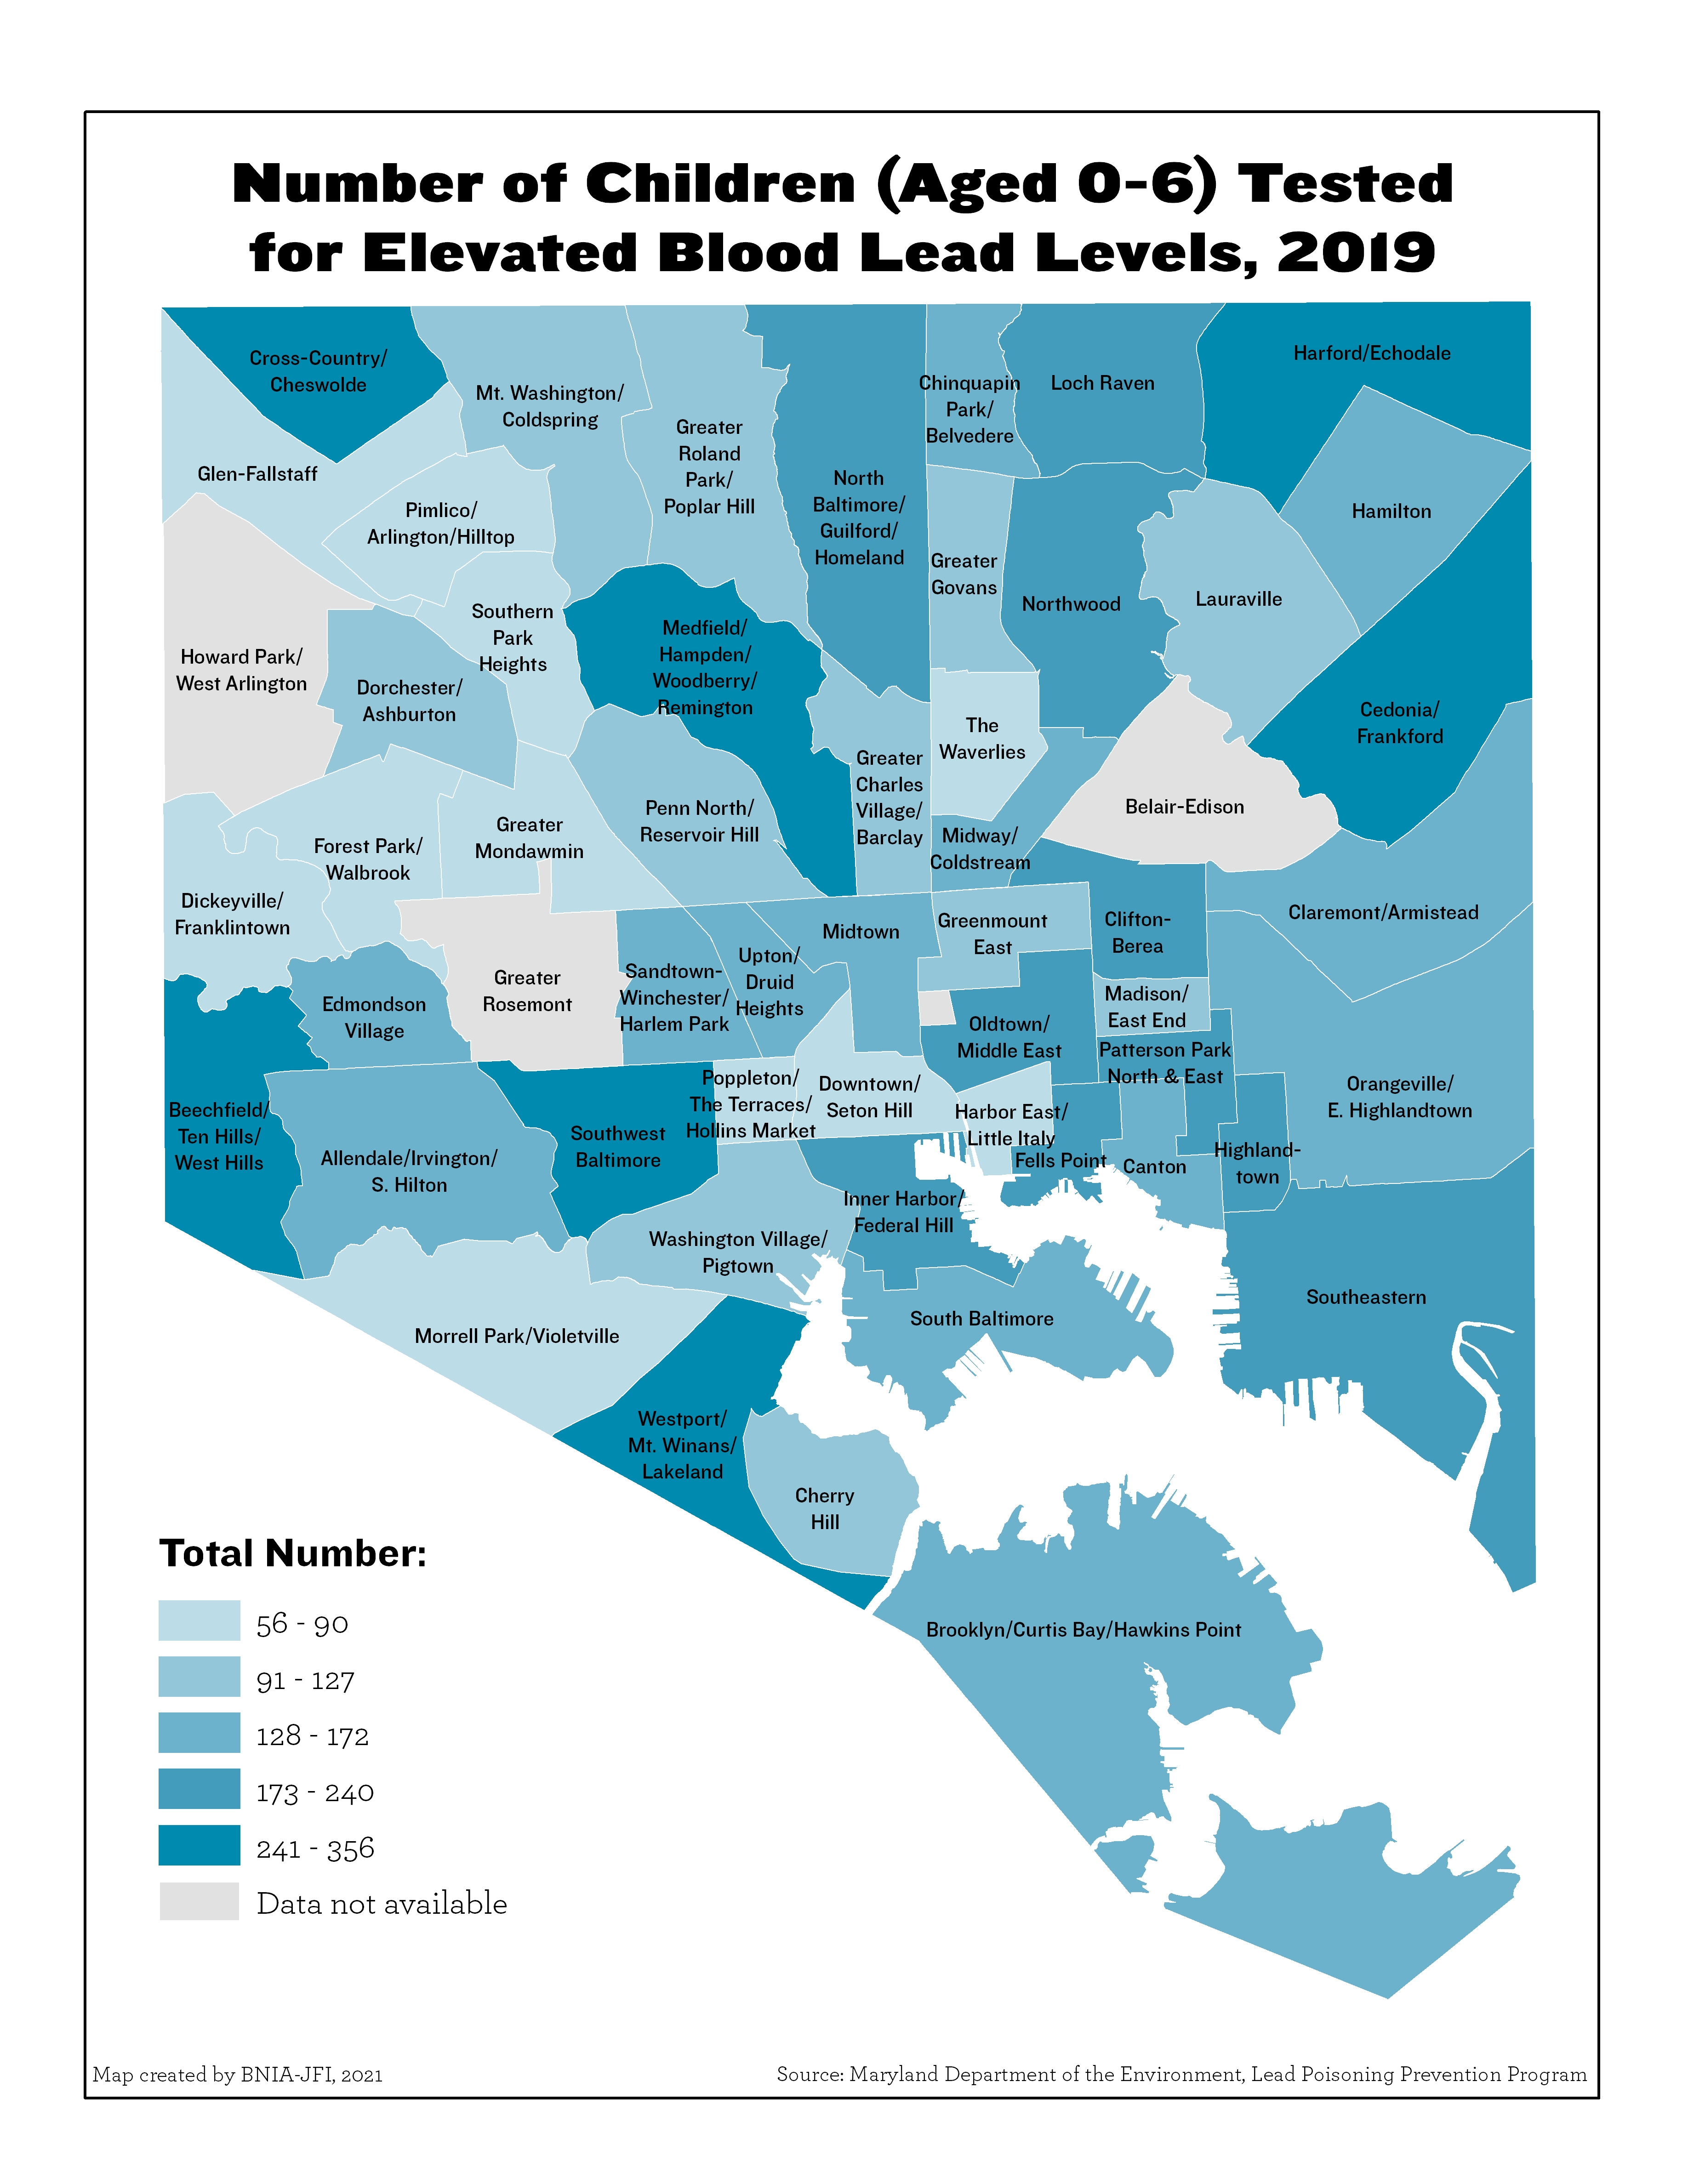
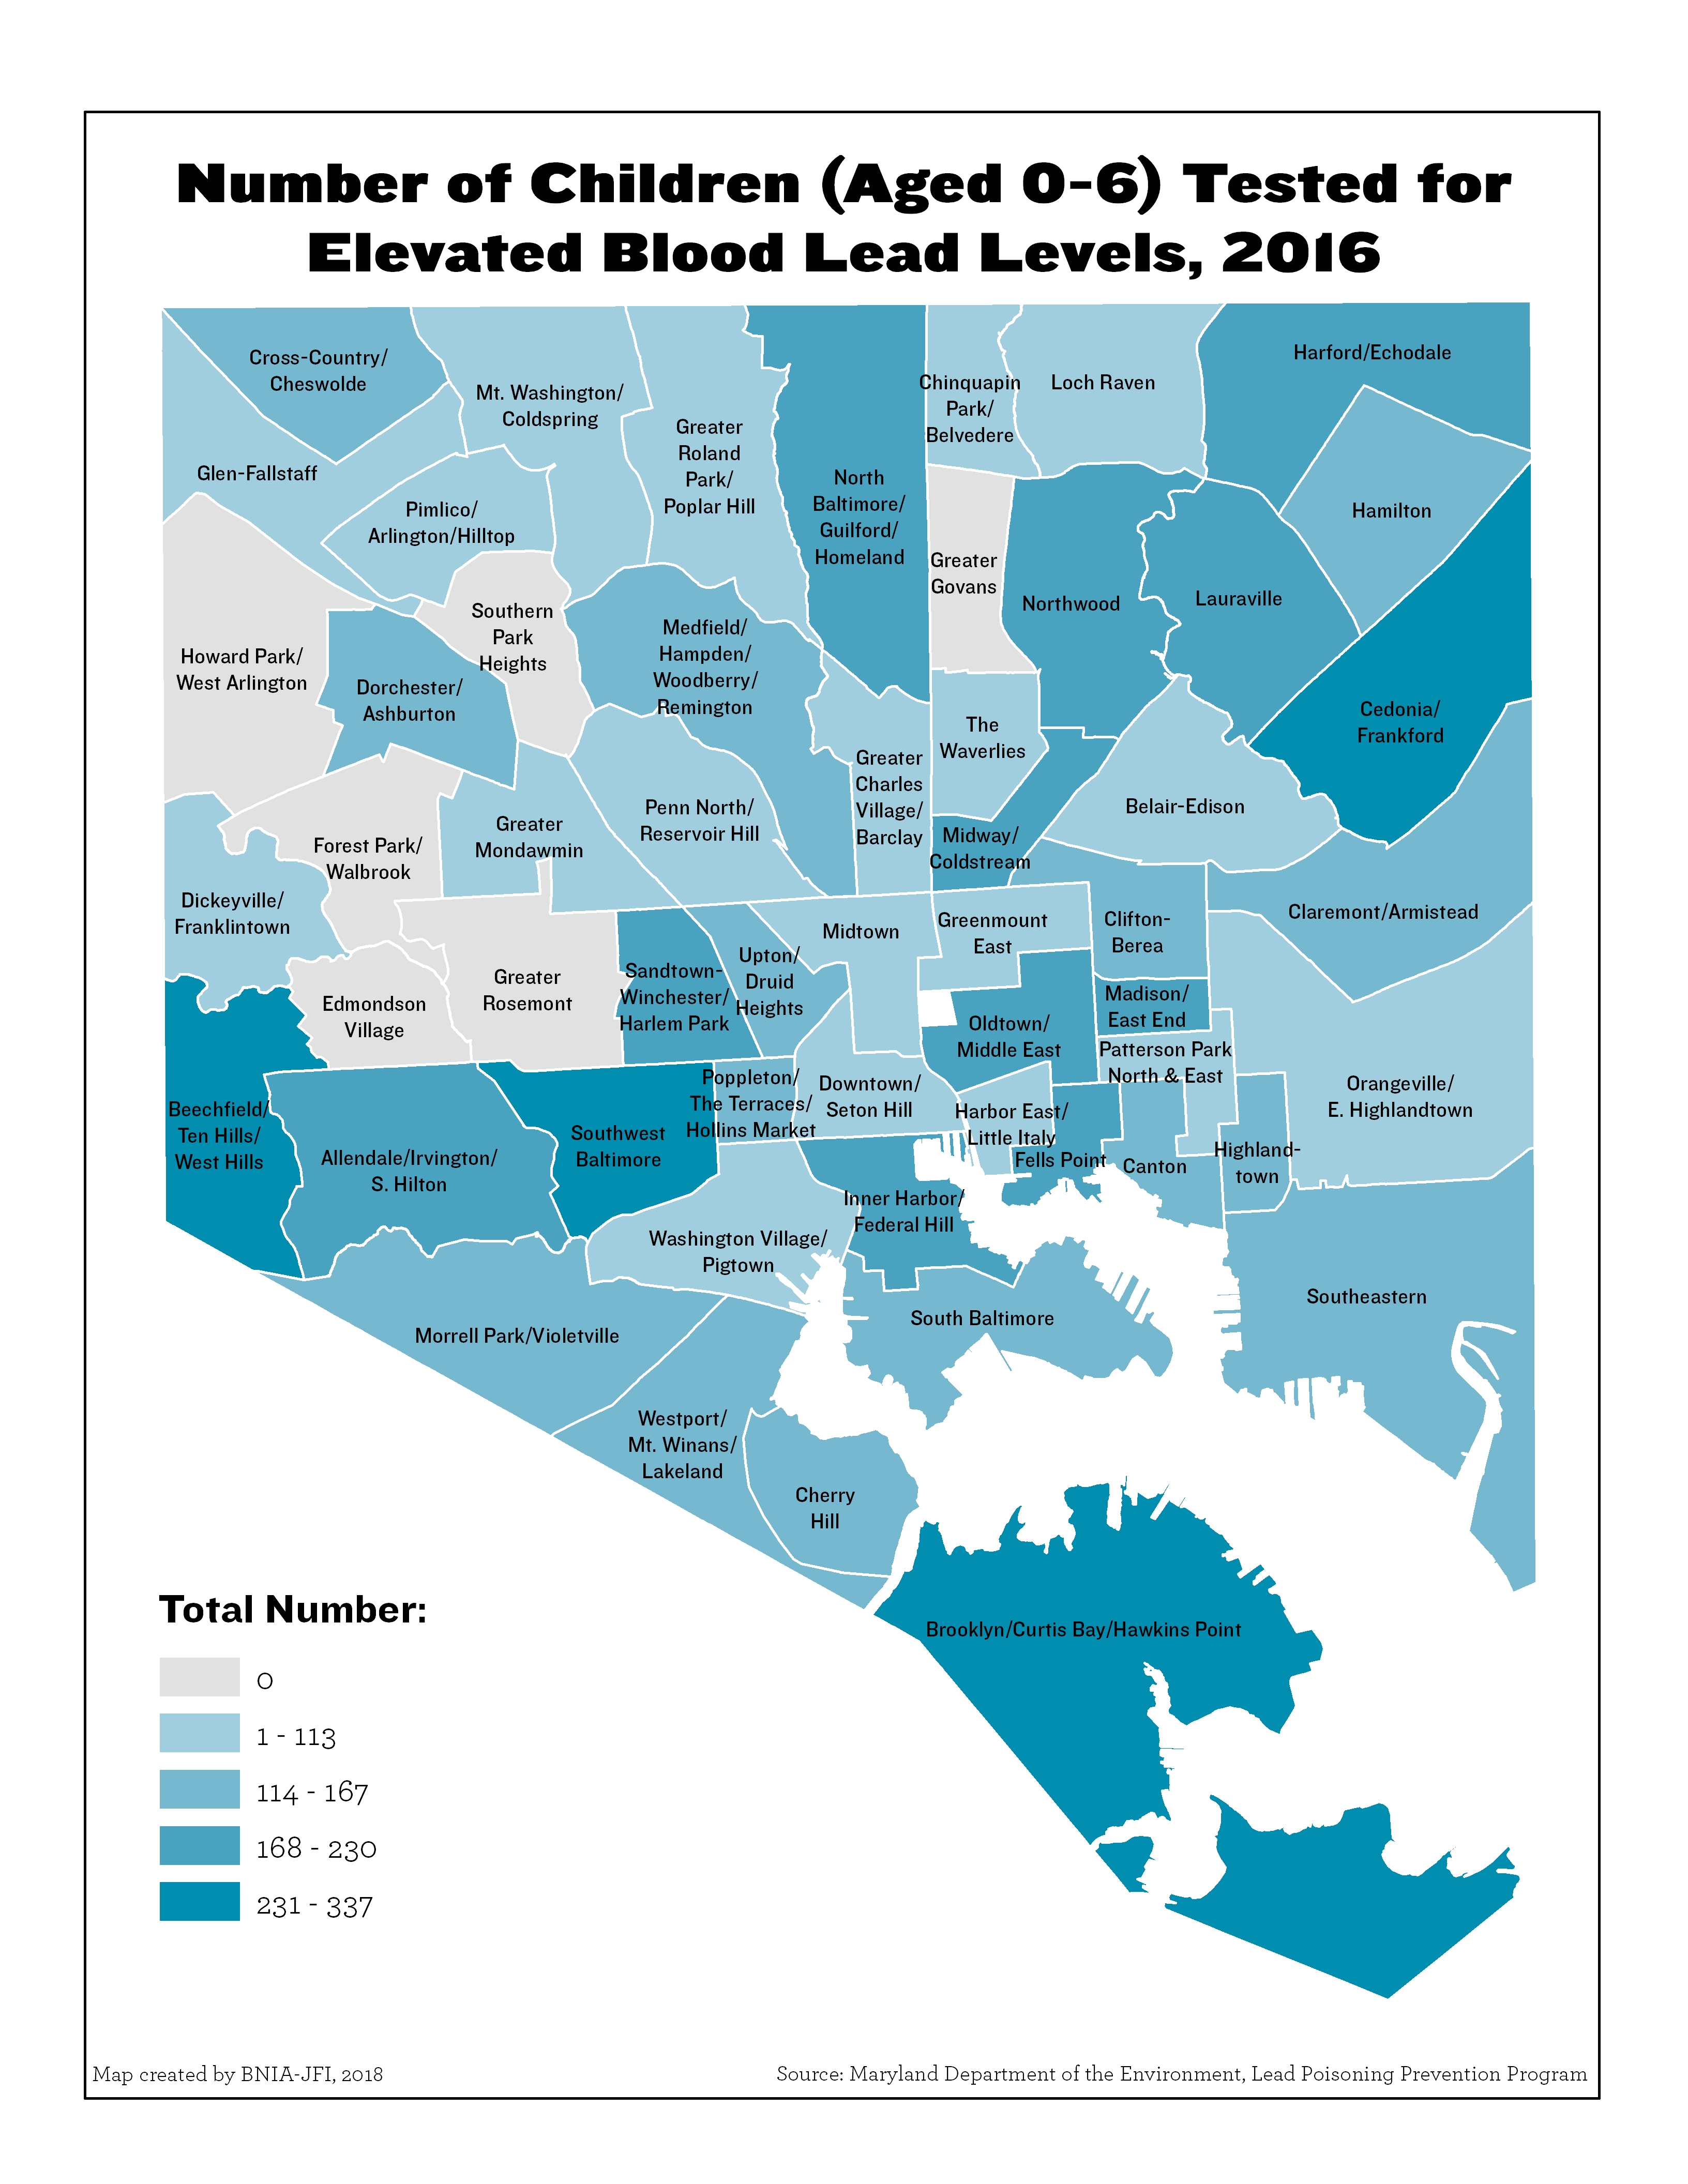
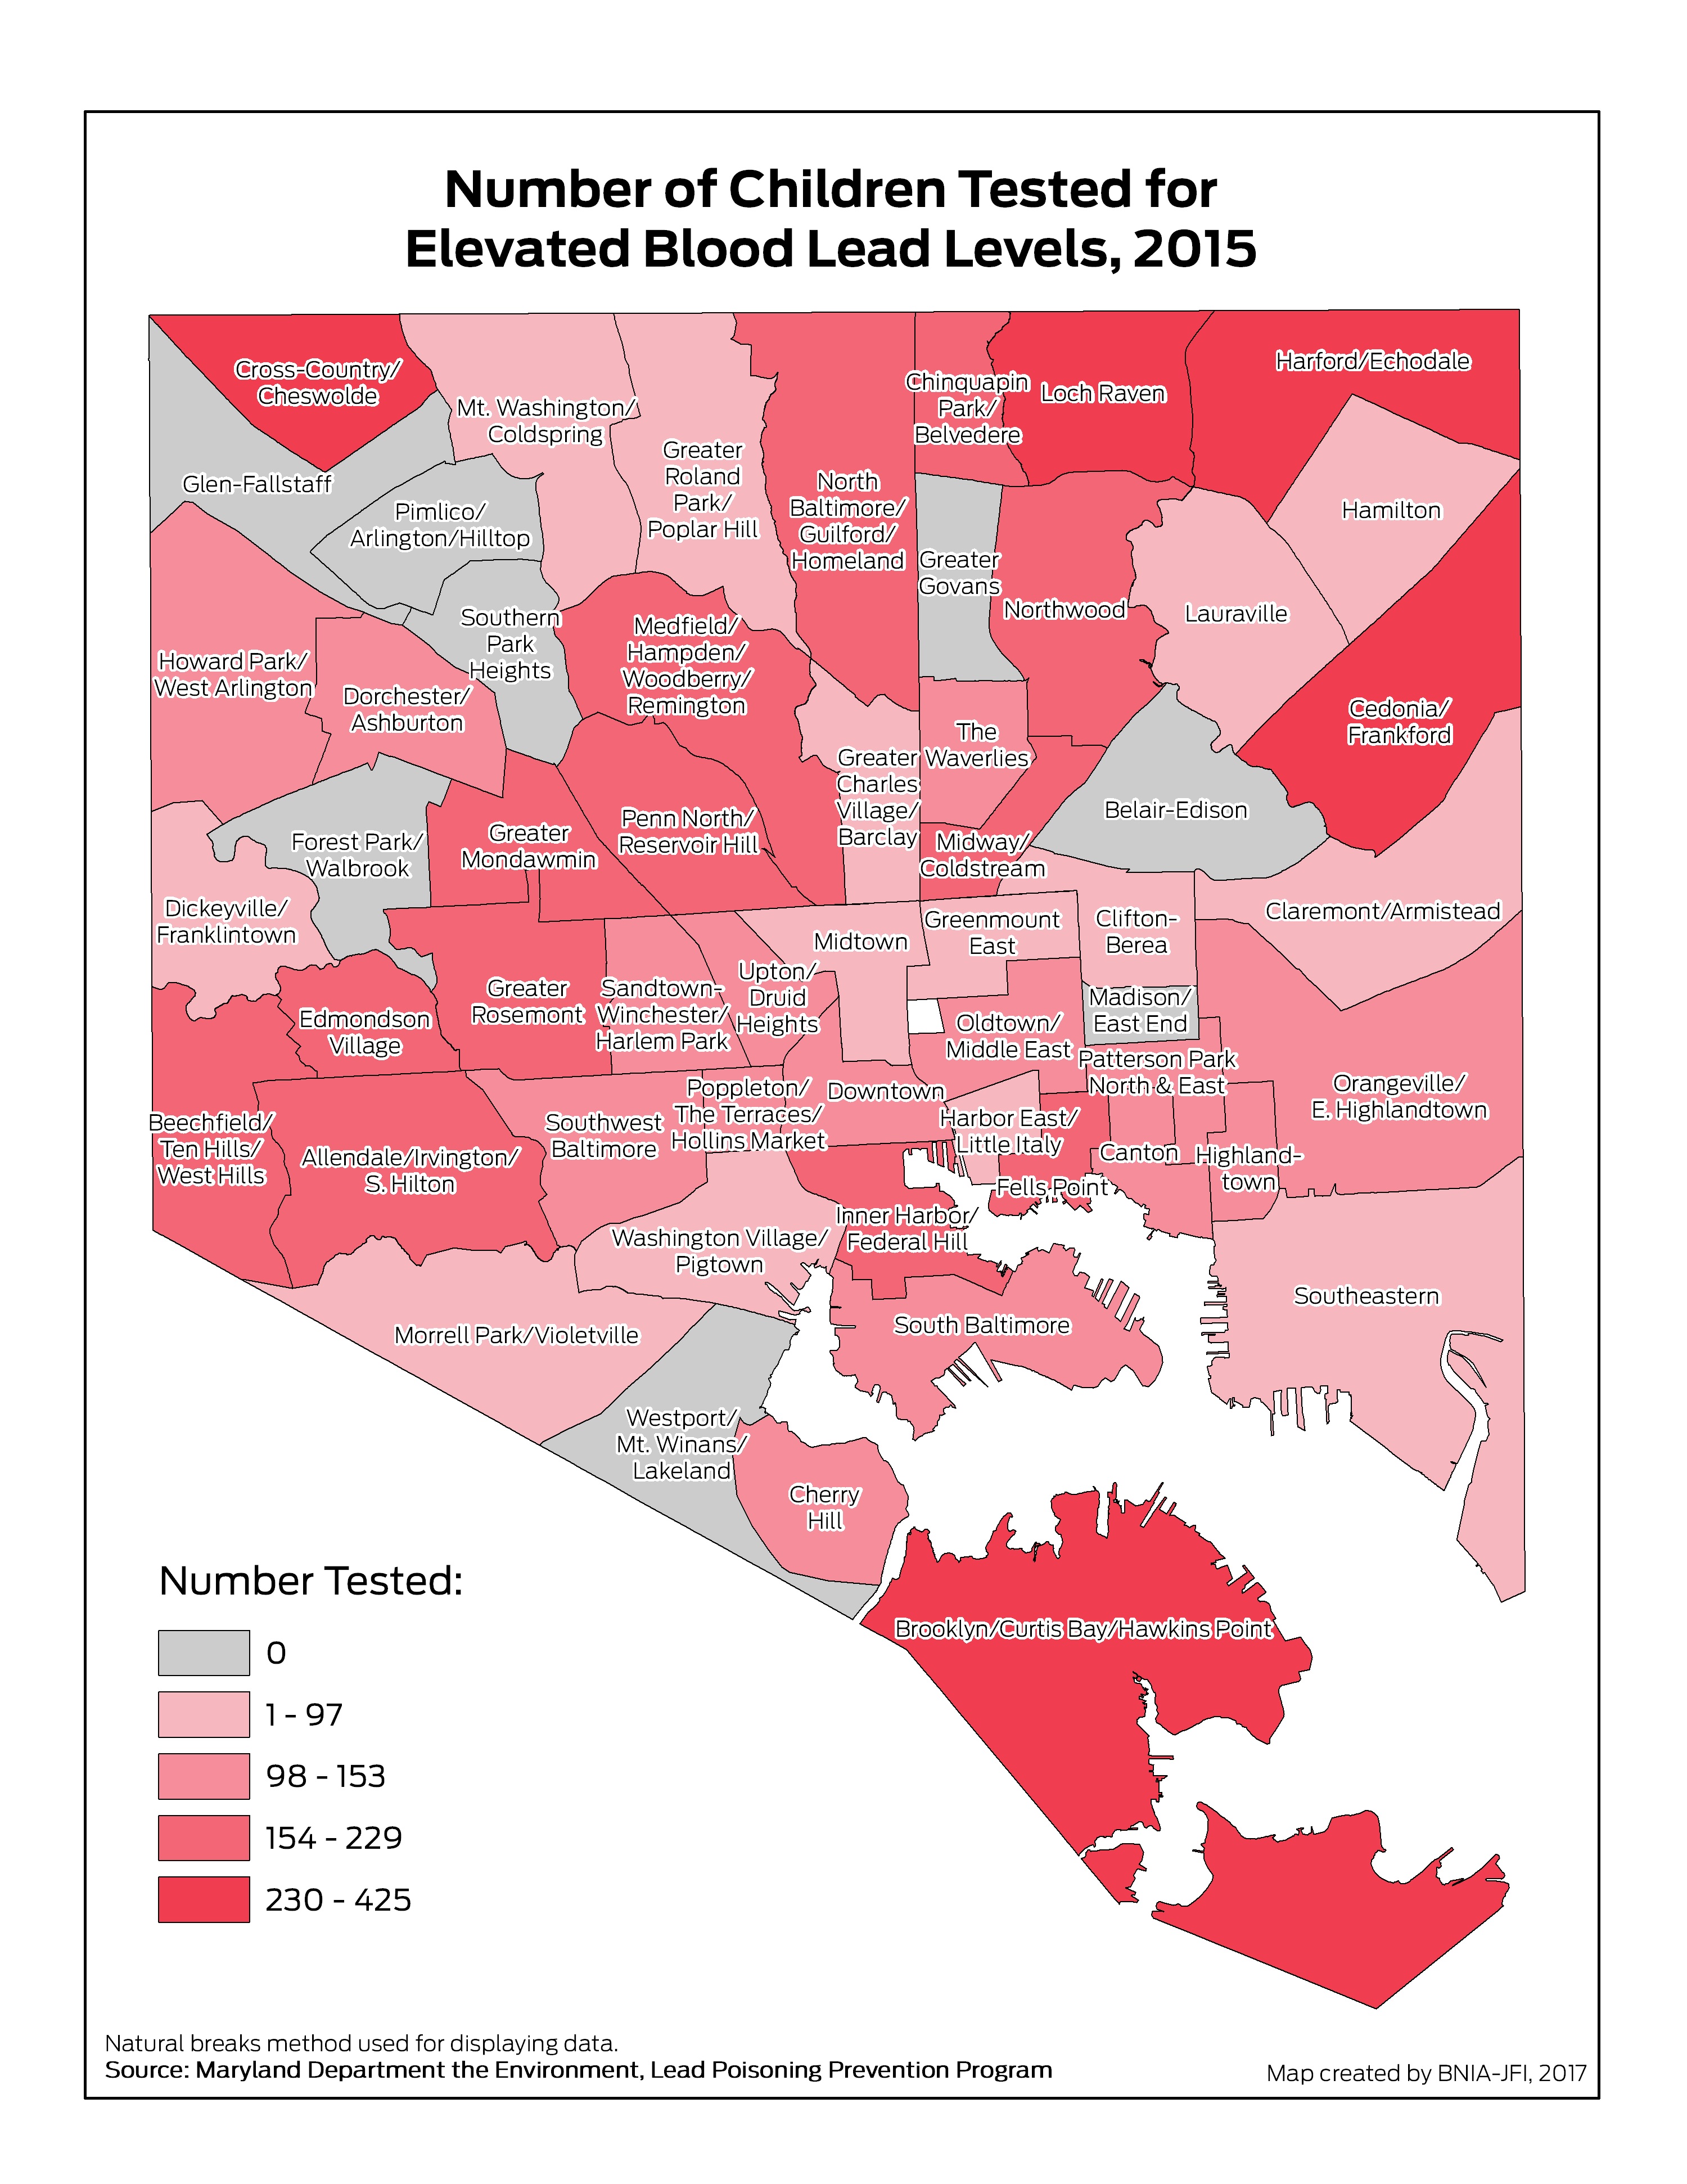
Number of Children (Aged 0-6) Tested for Elevated Blood Lead Levels
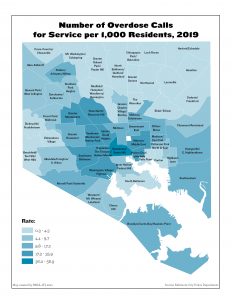
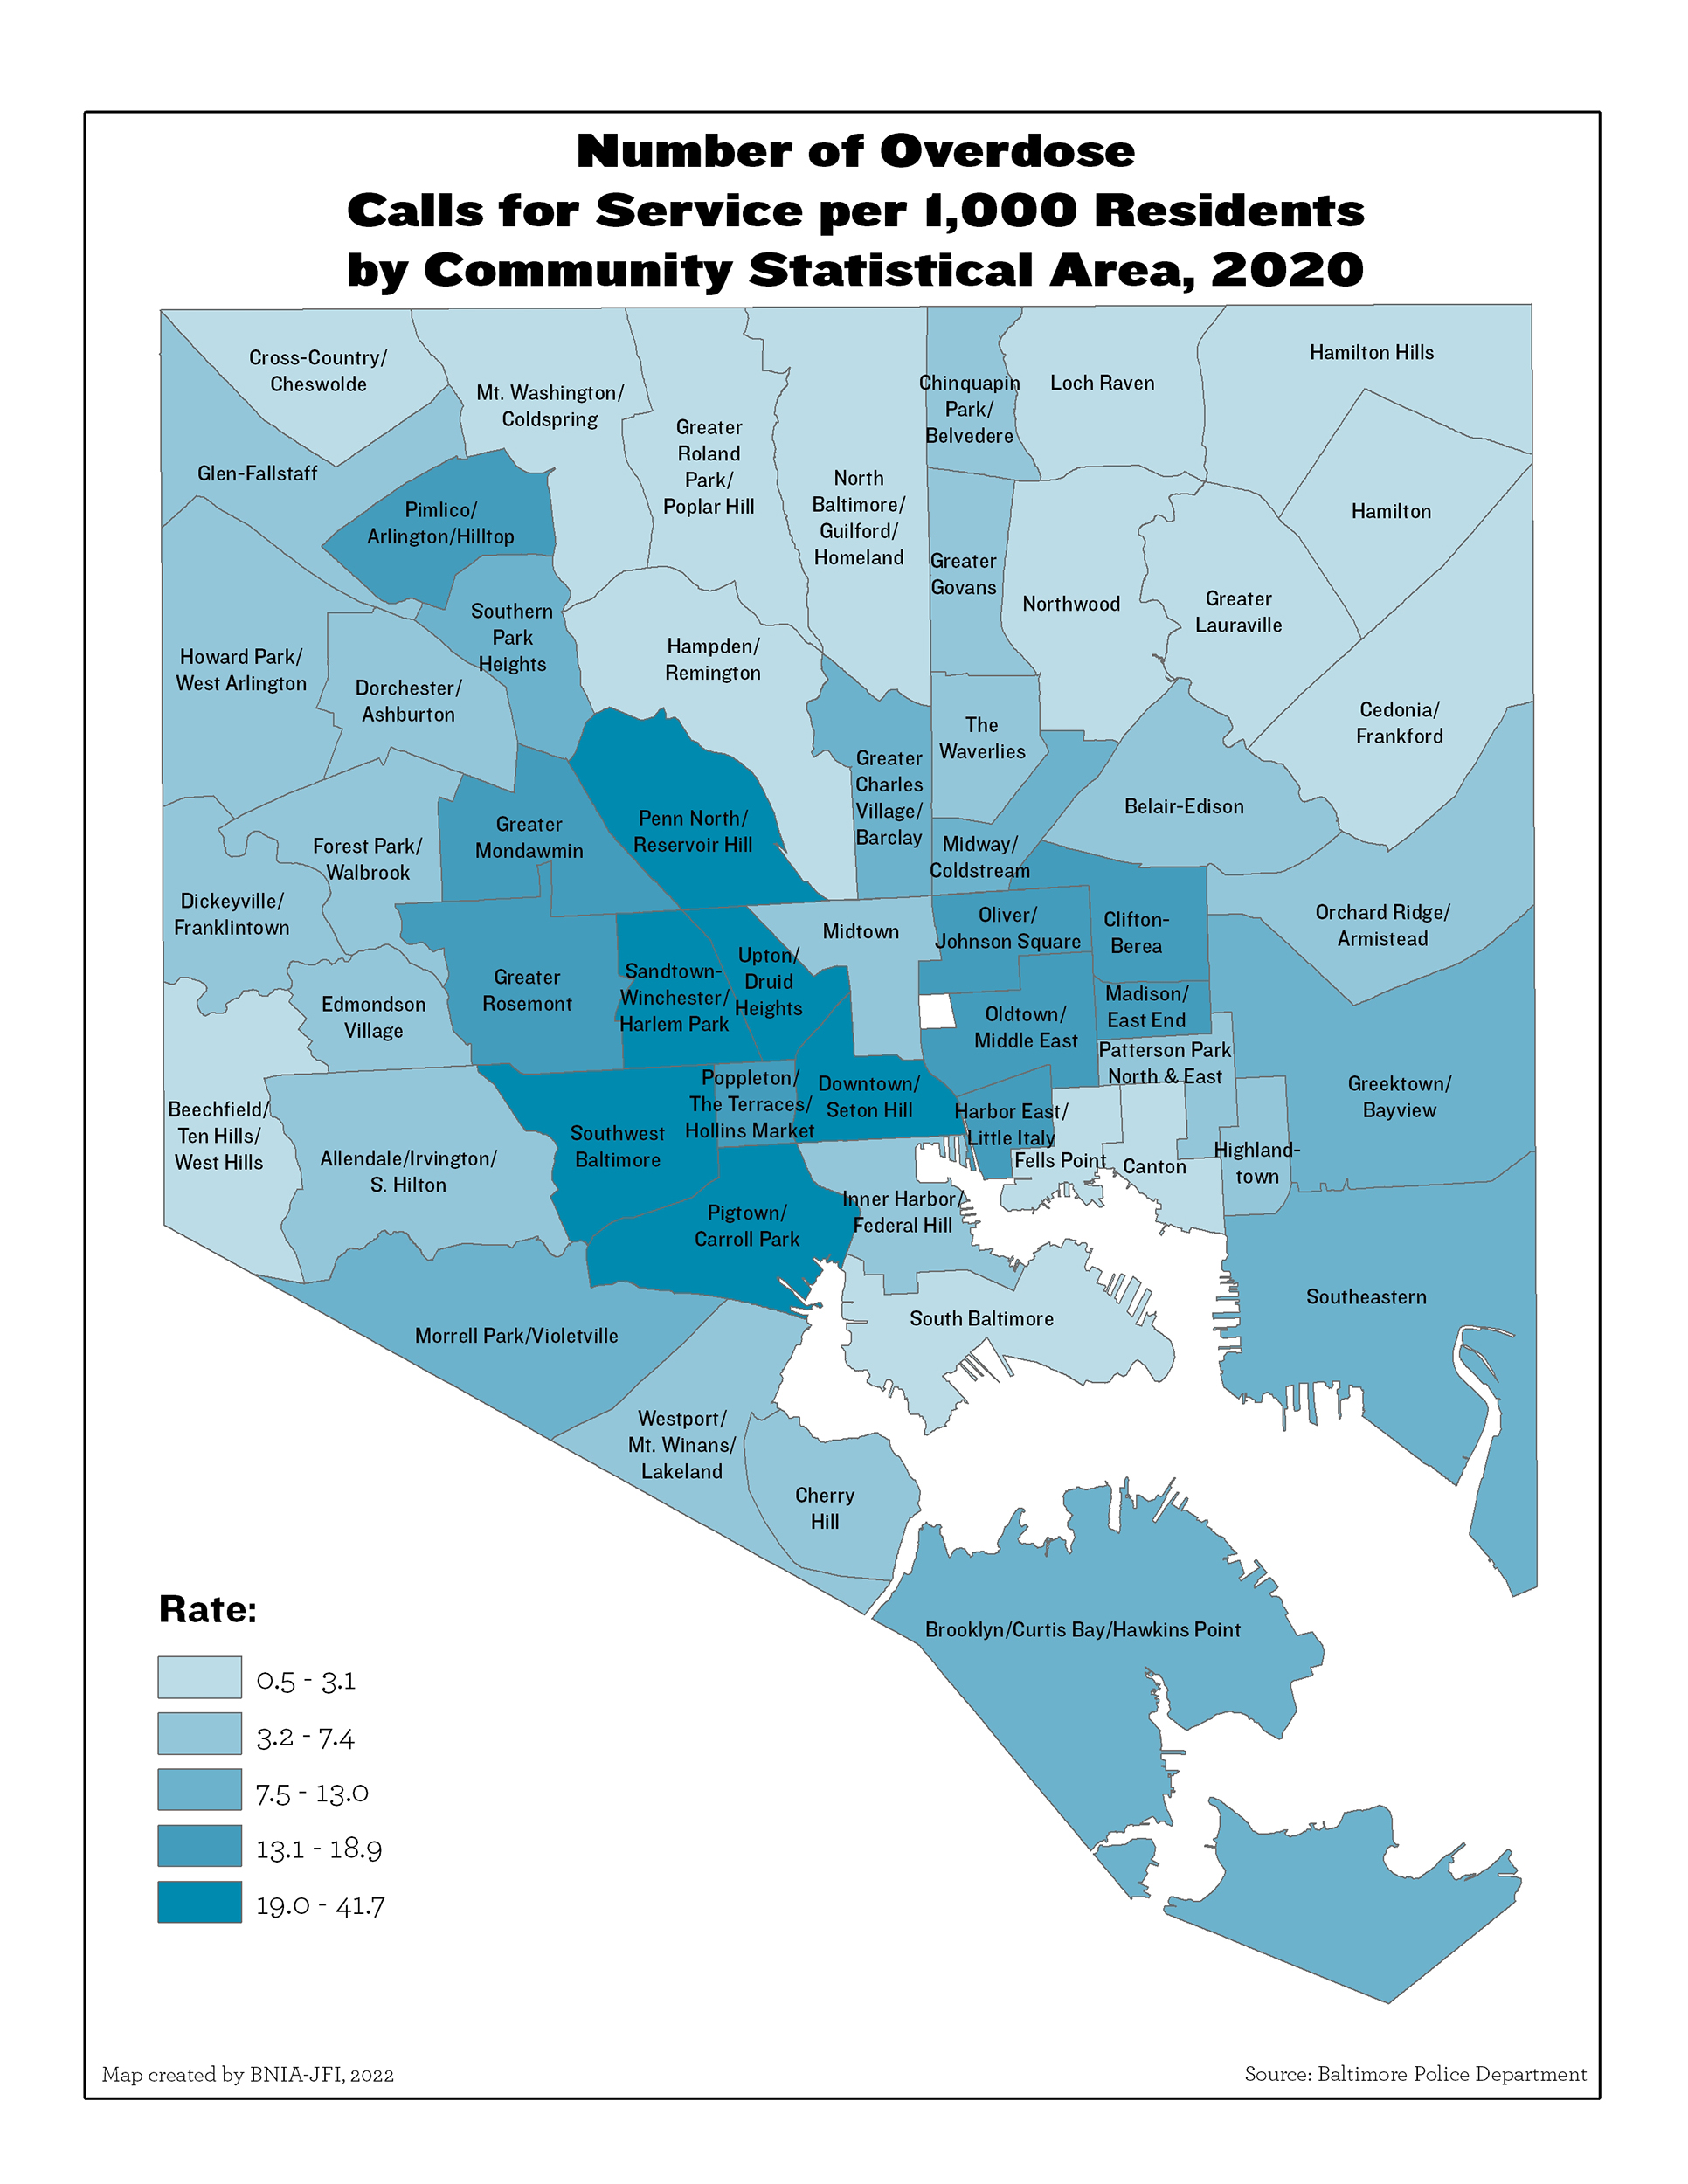
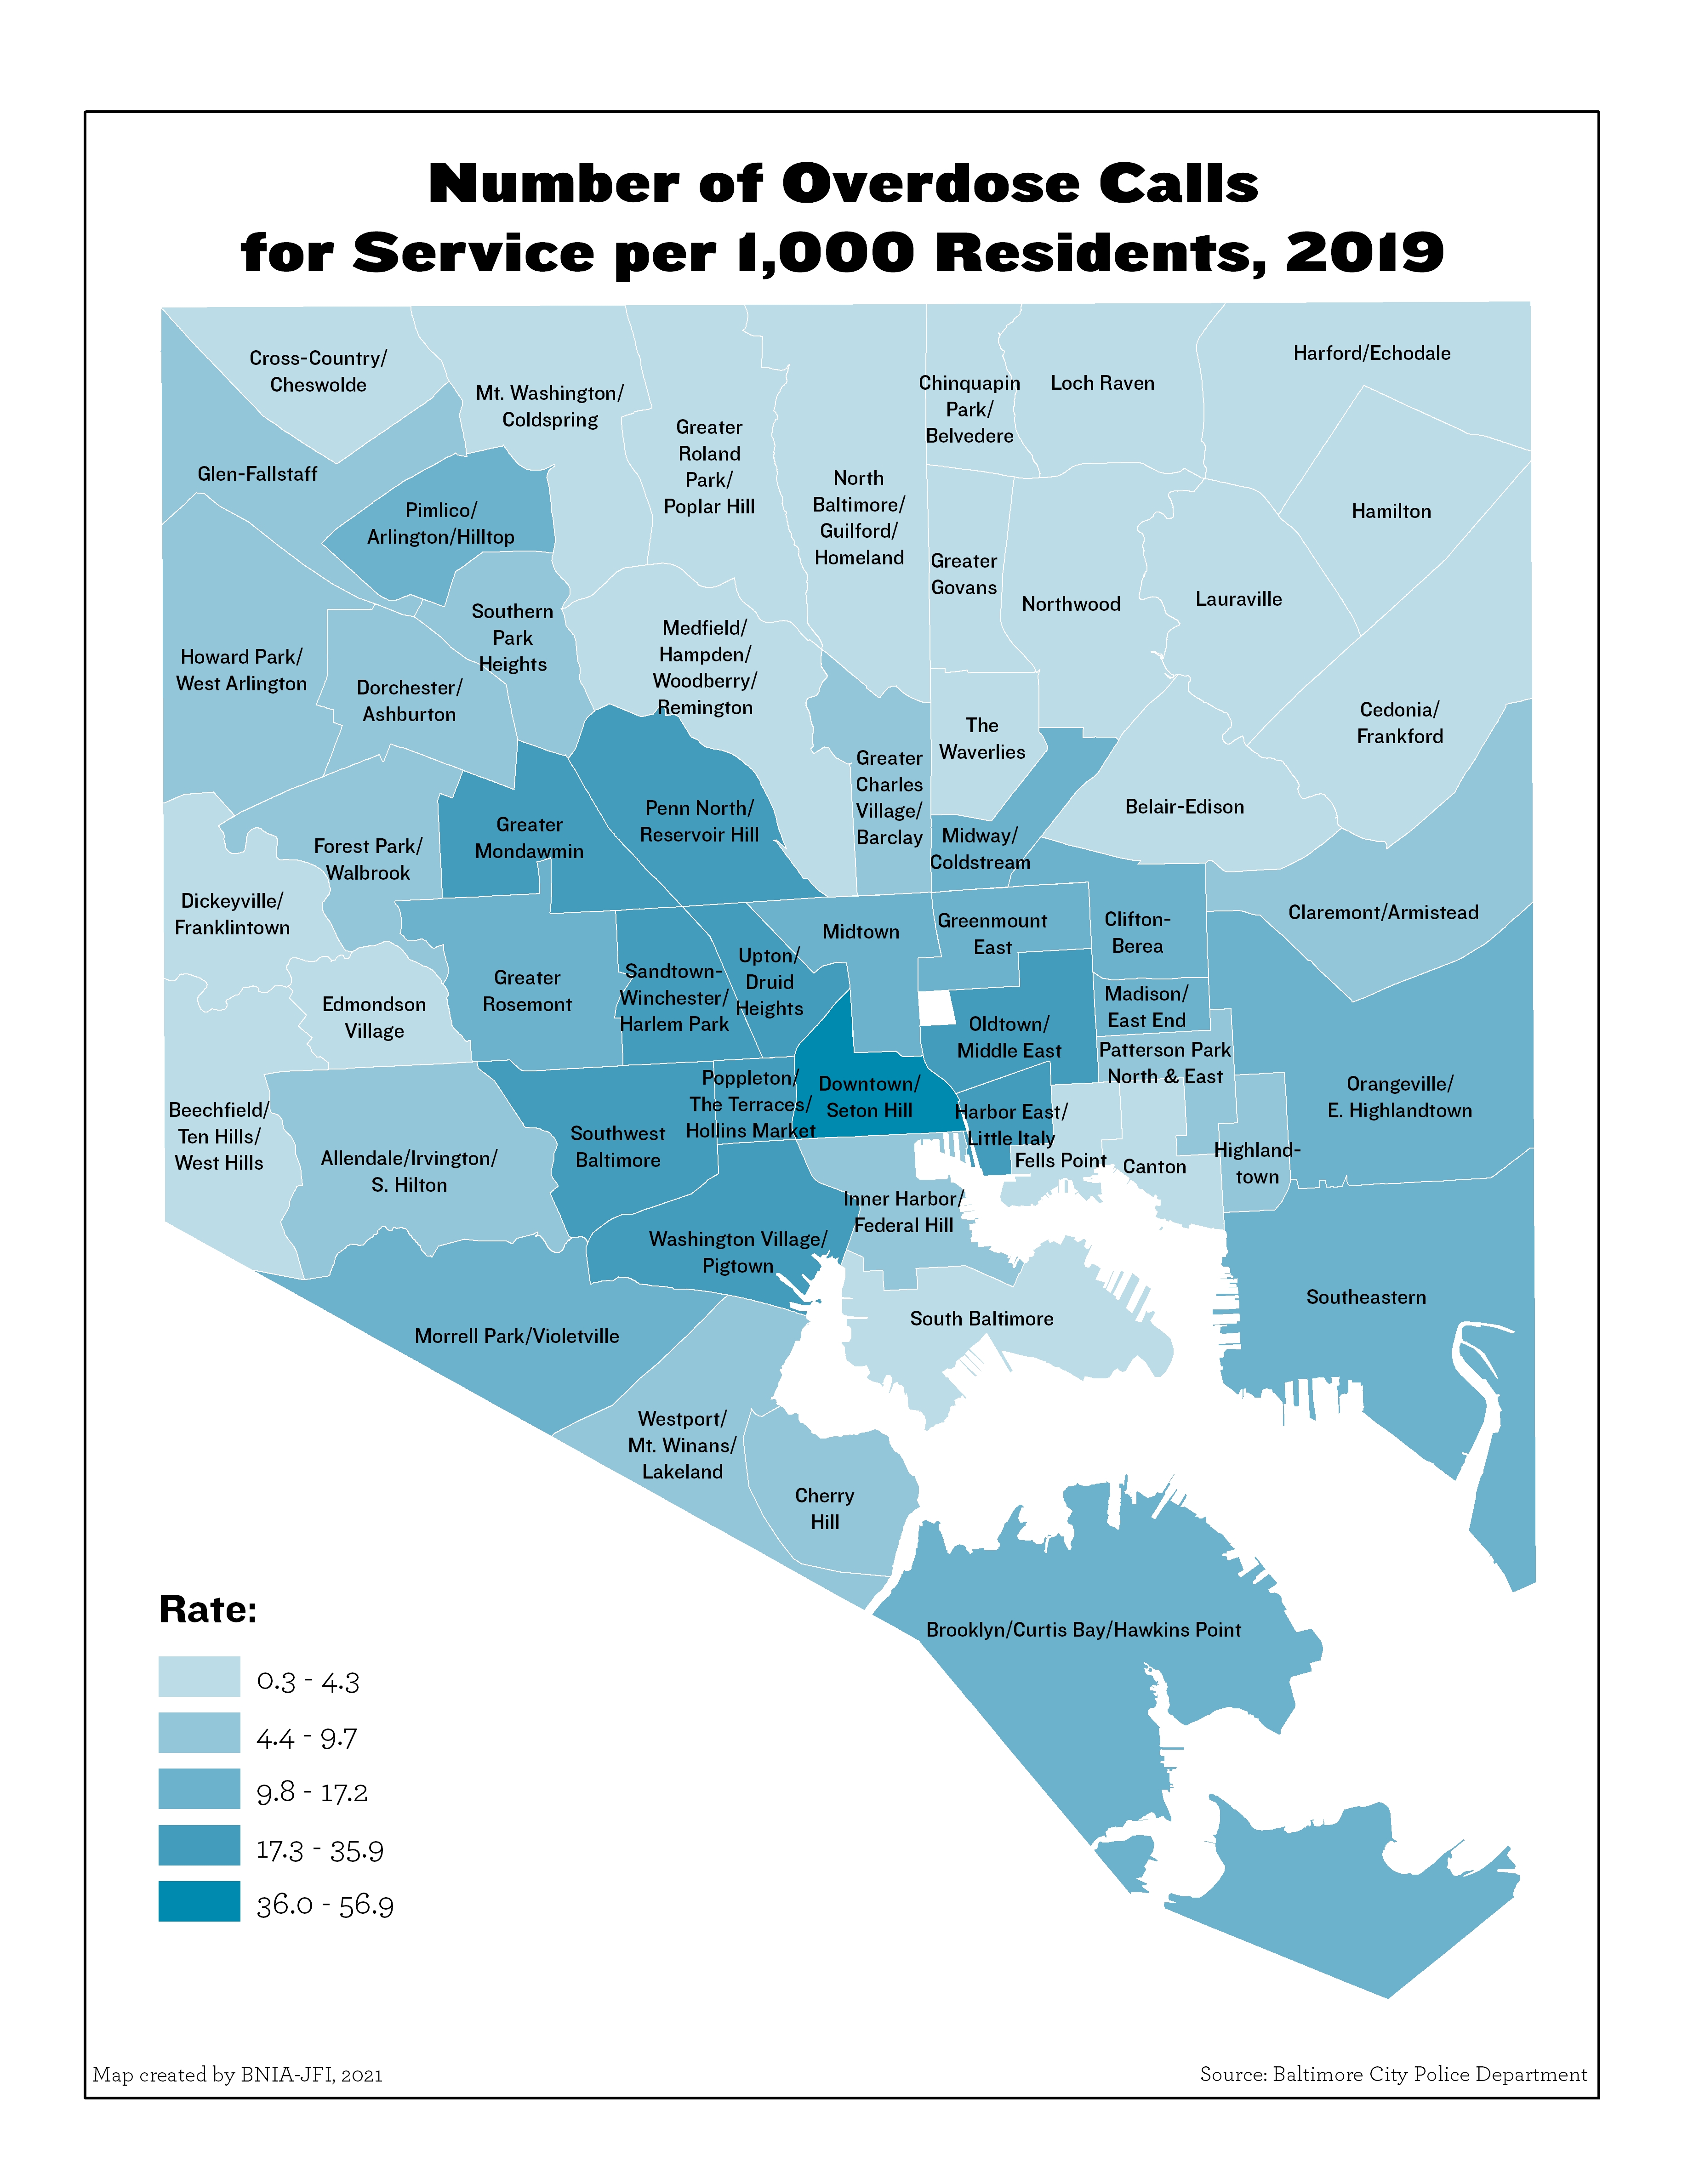
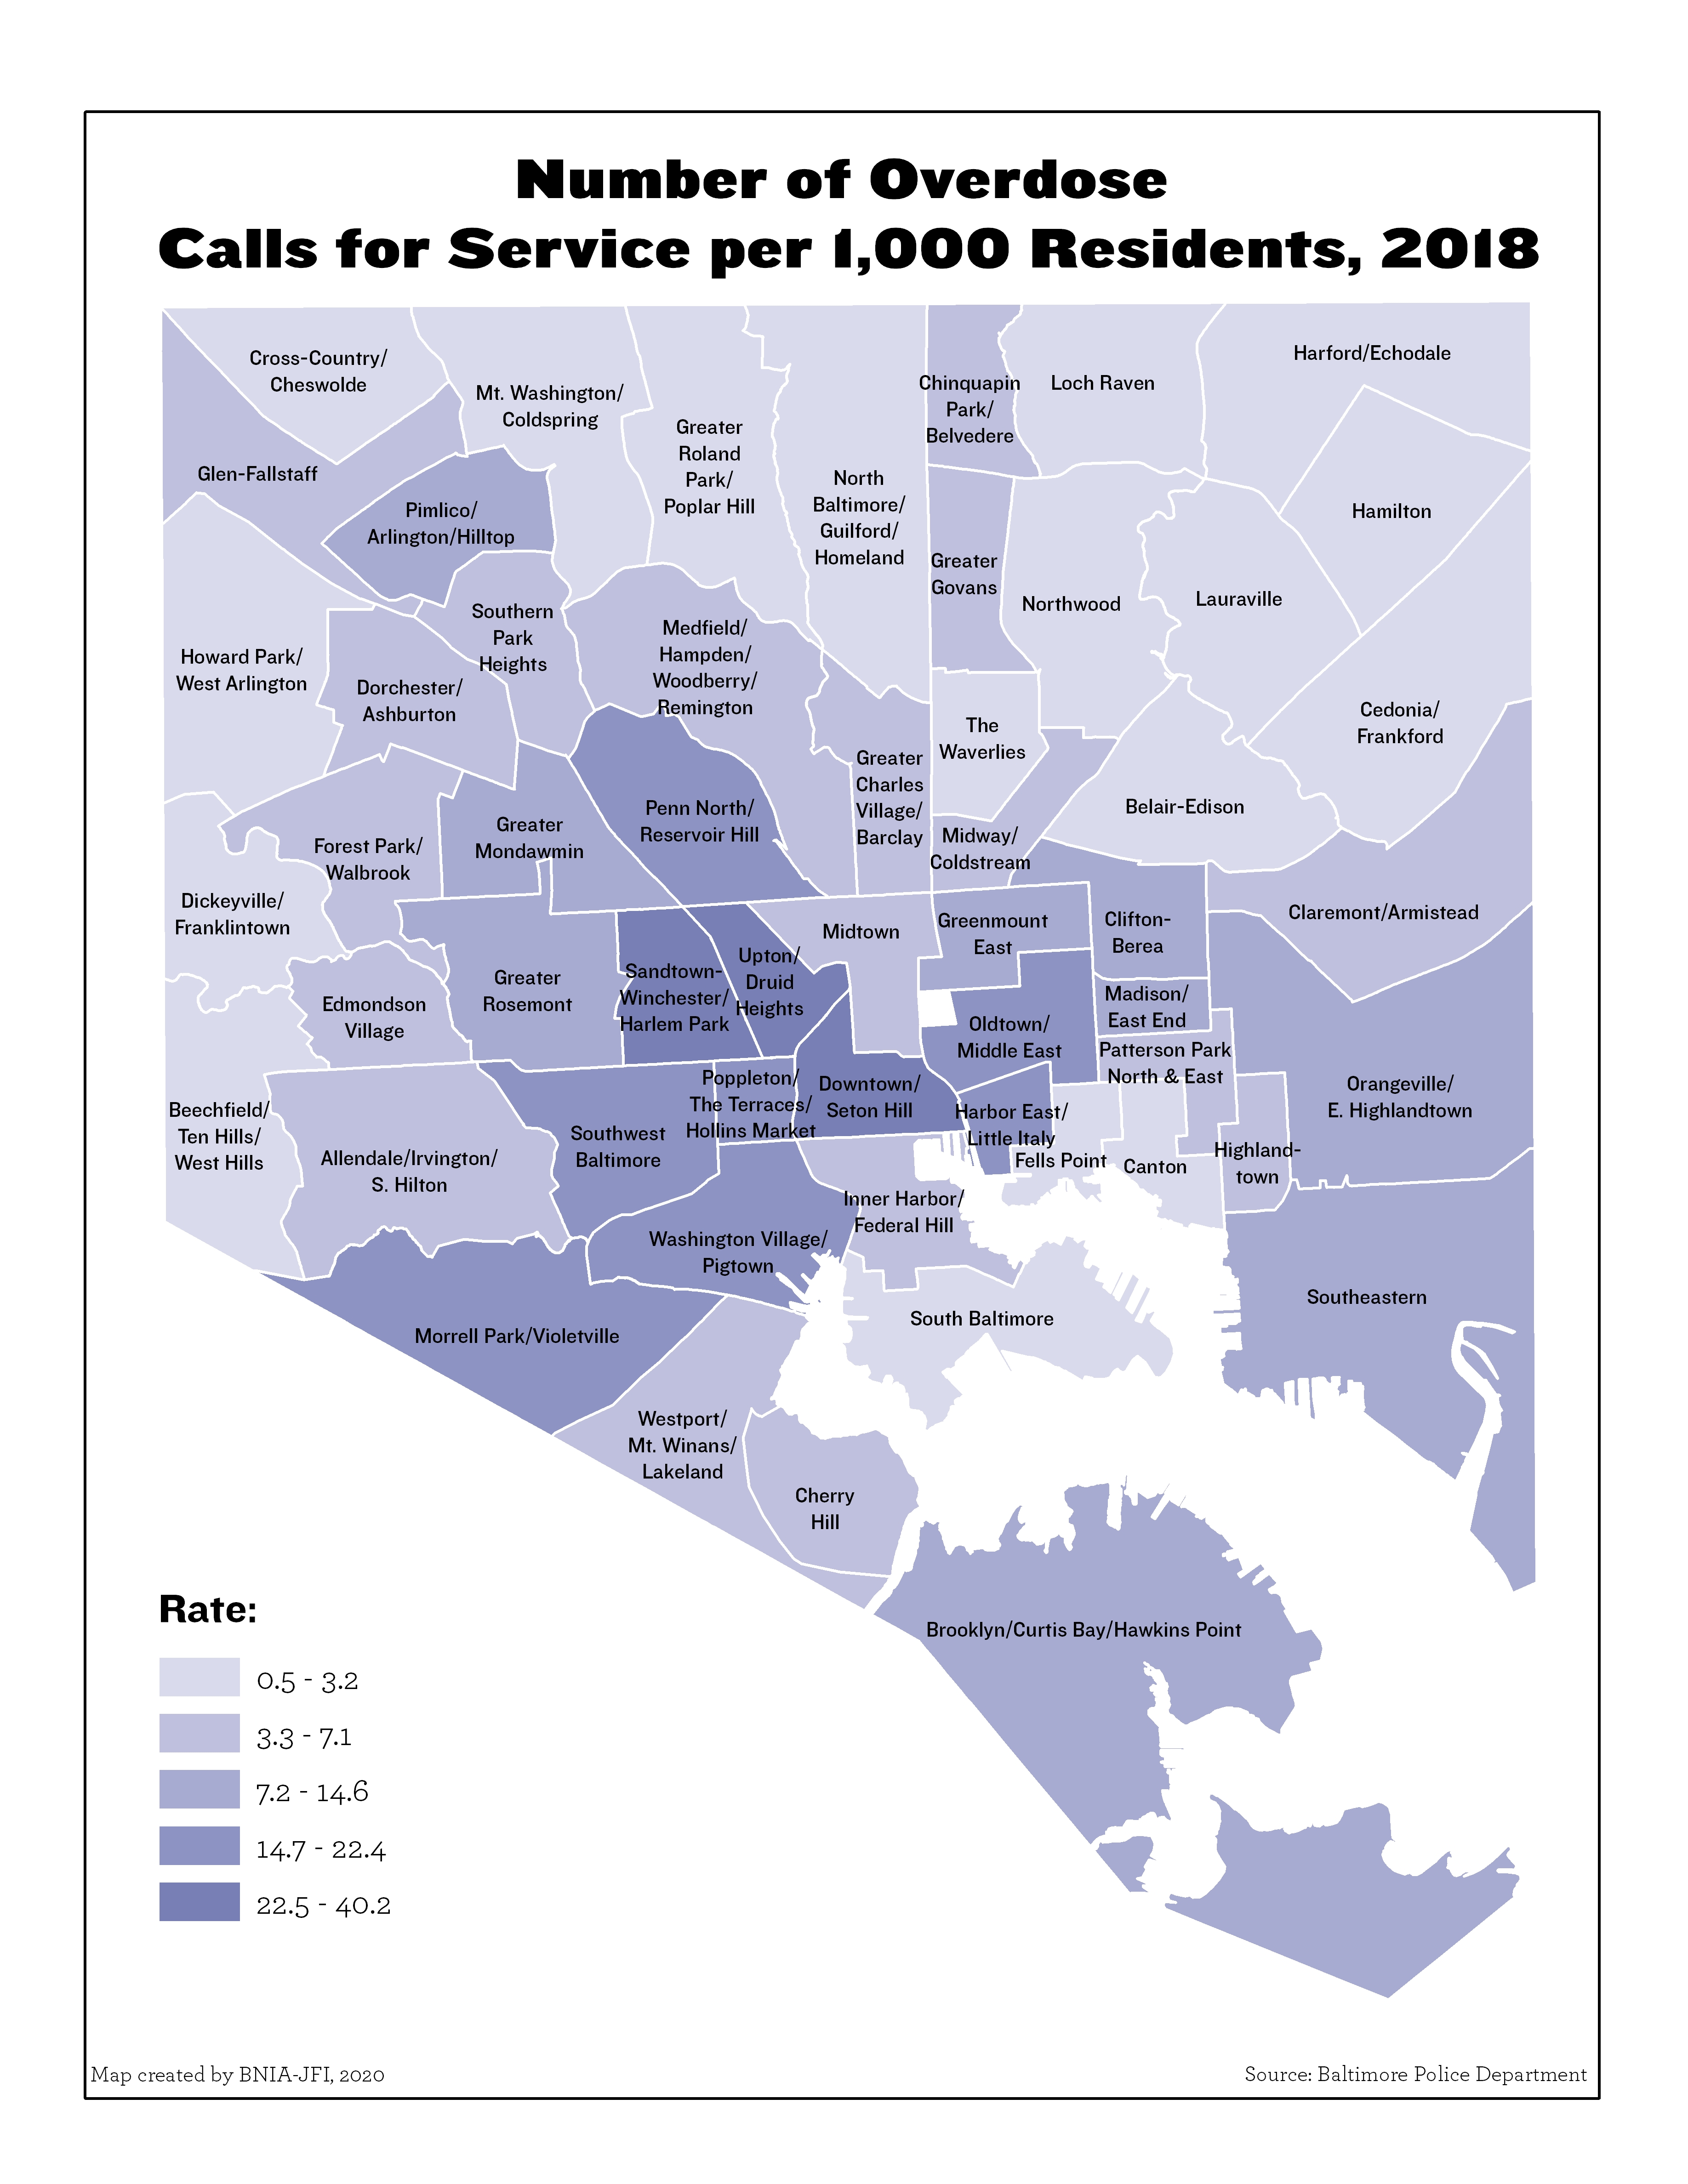
Number of Overdose Calls for Service per 1,000 Residents (2019)
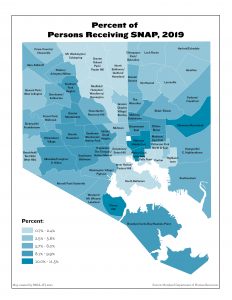
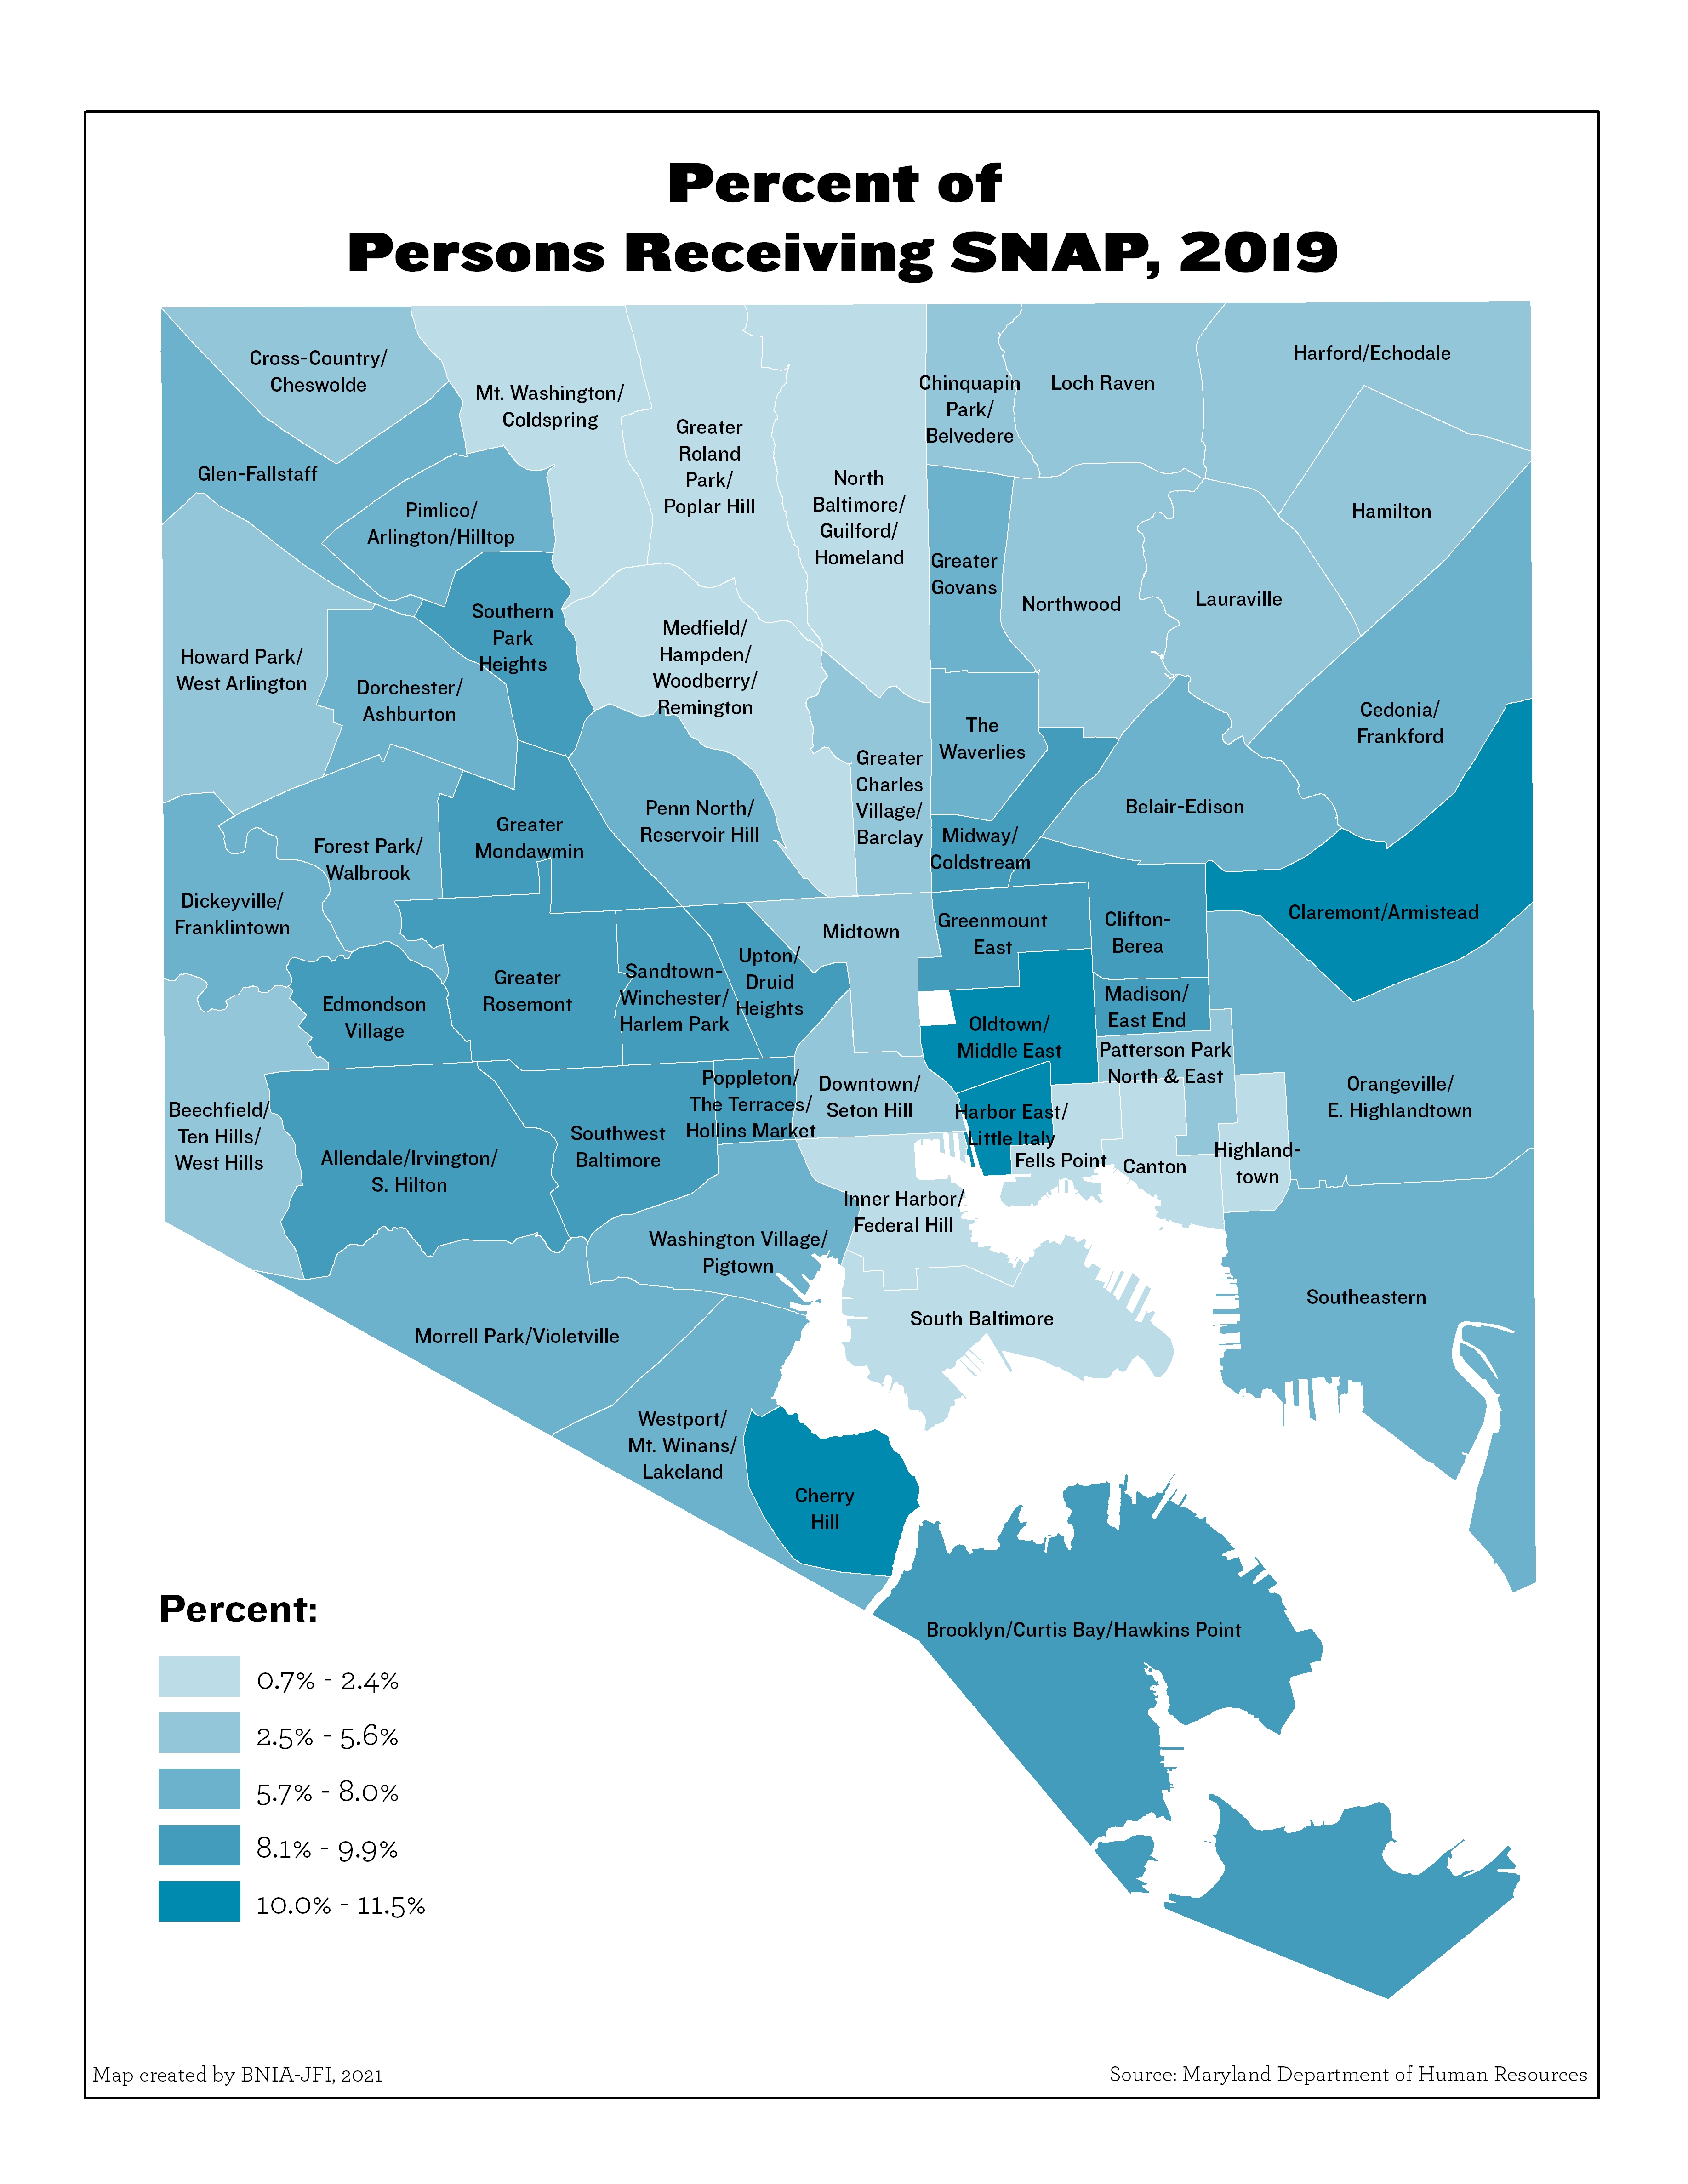
Percent of Persons Receiving SNAP
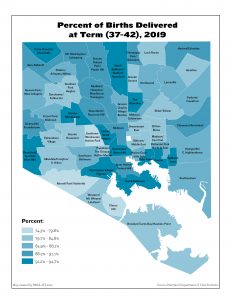
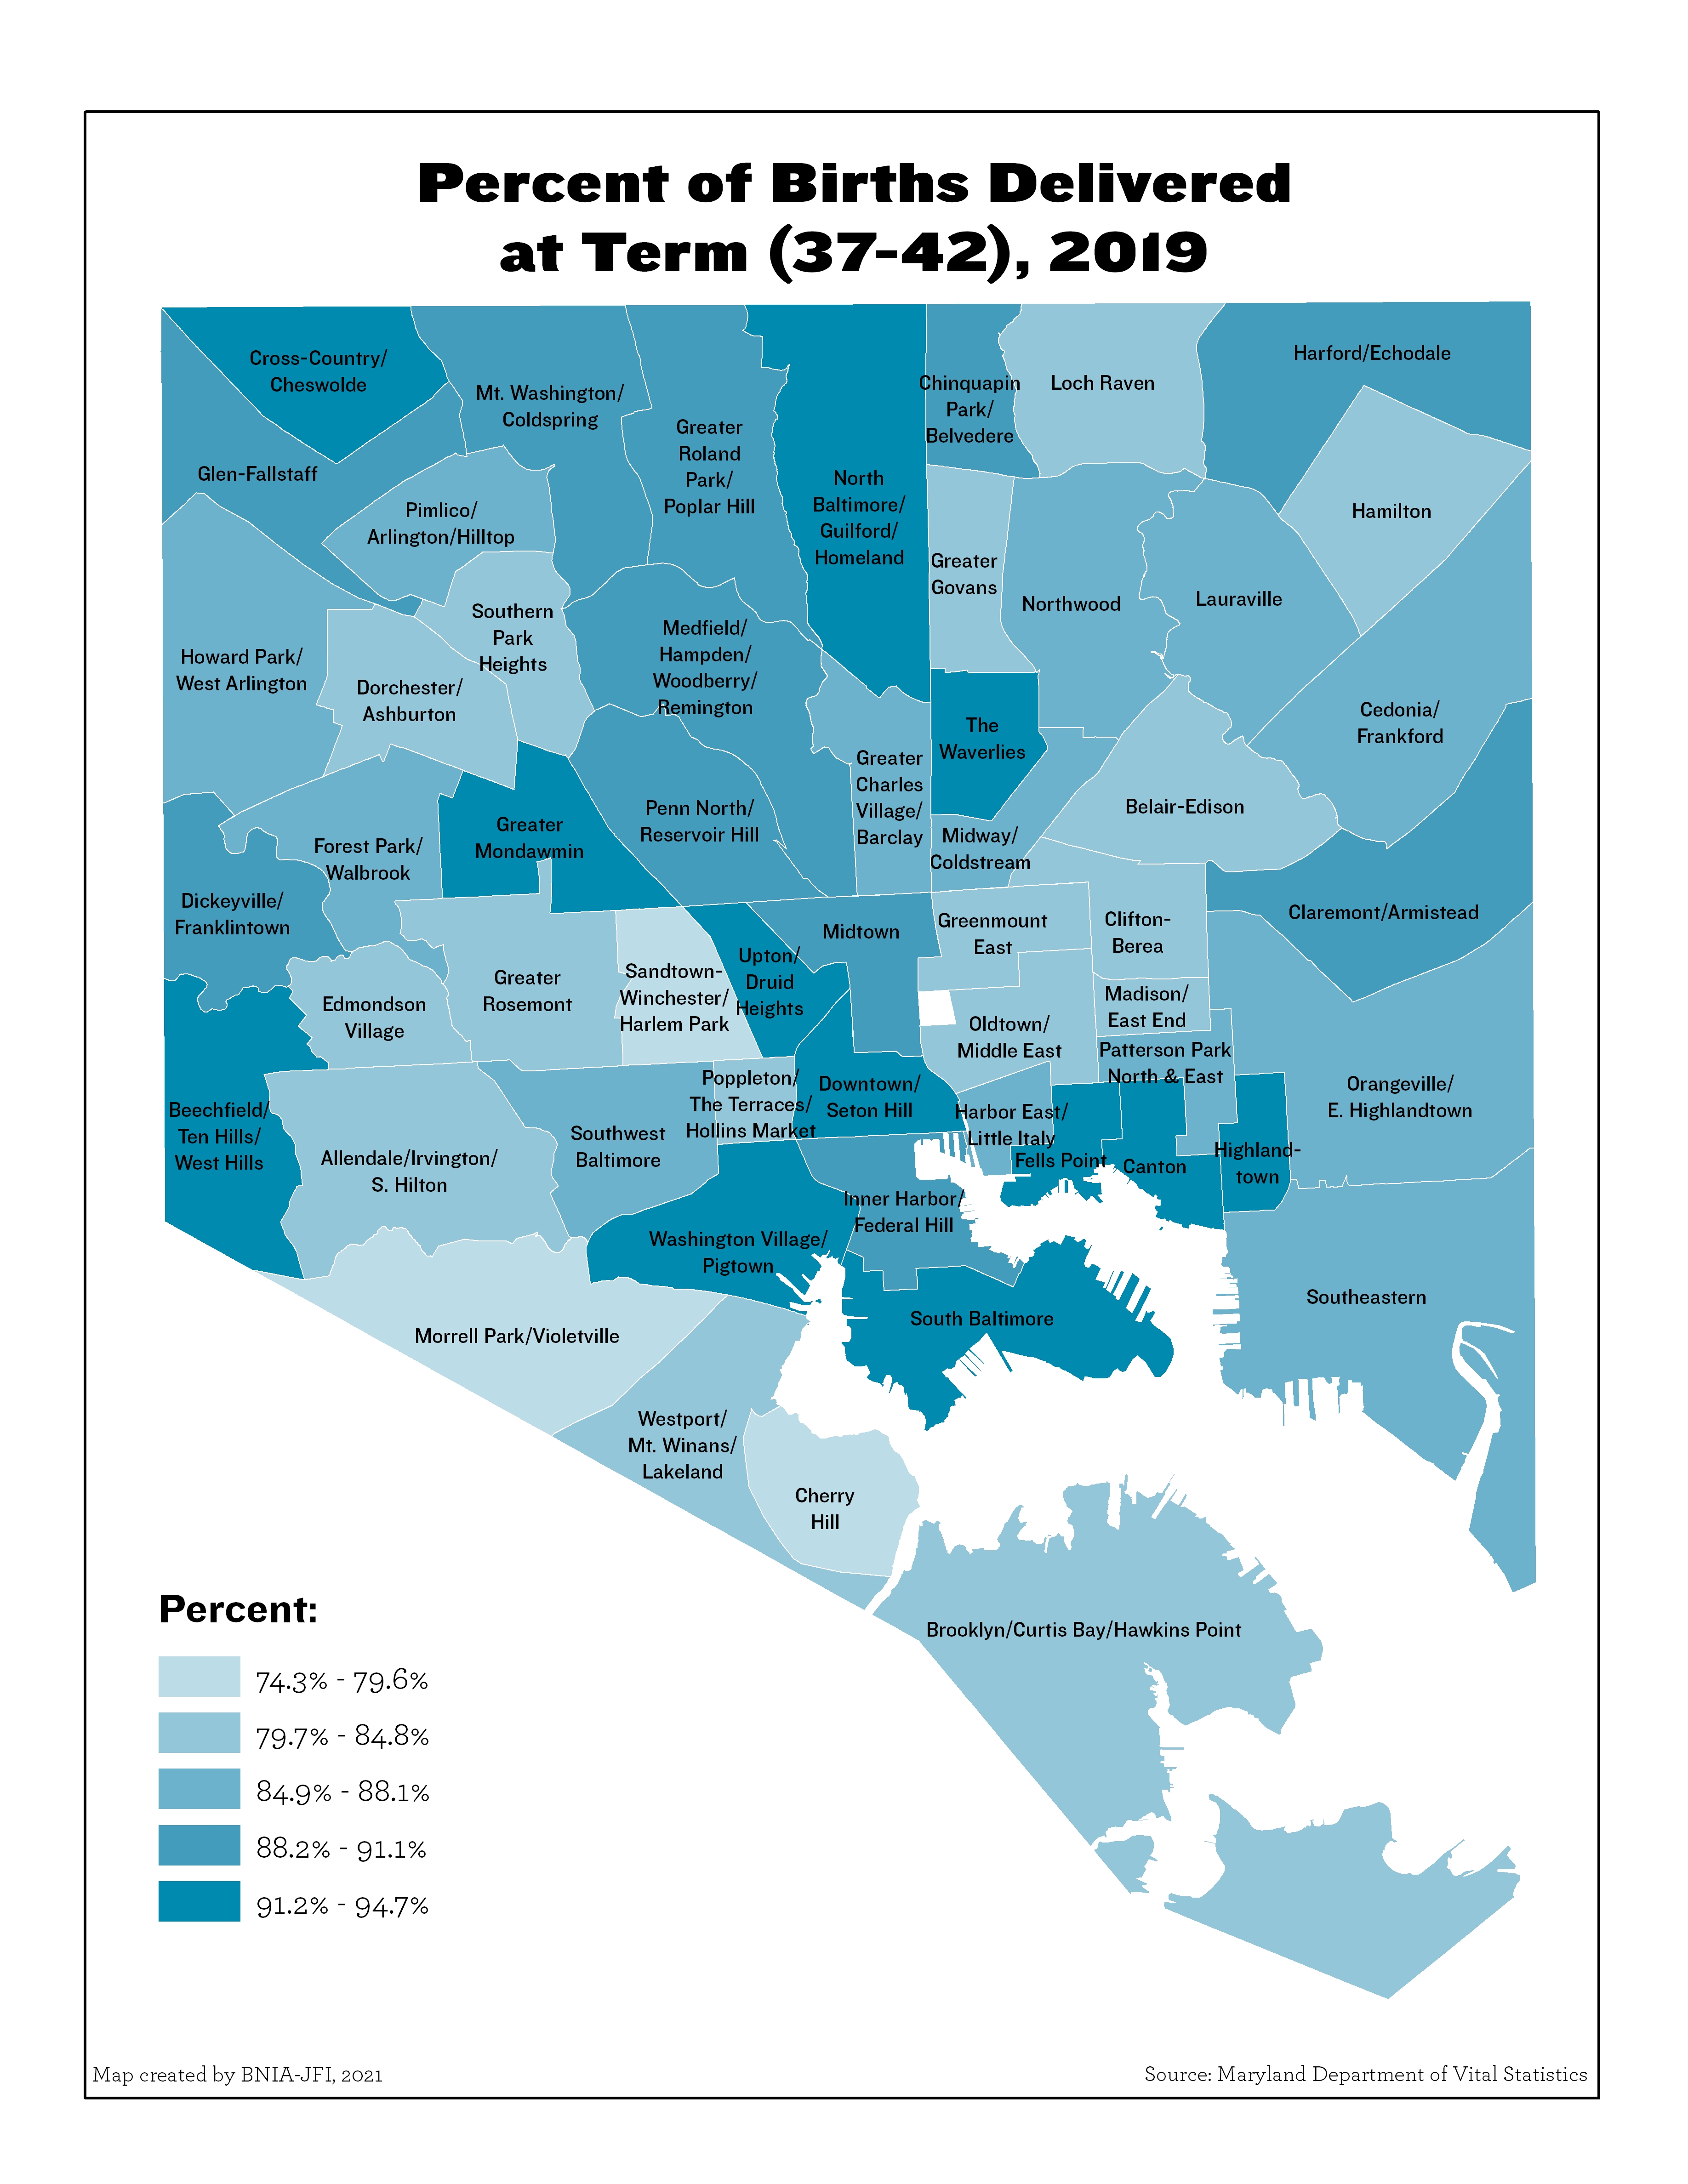
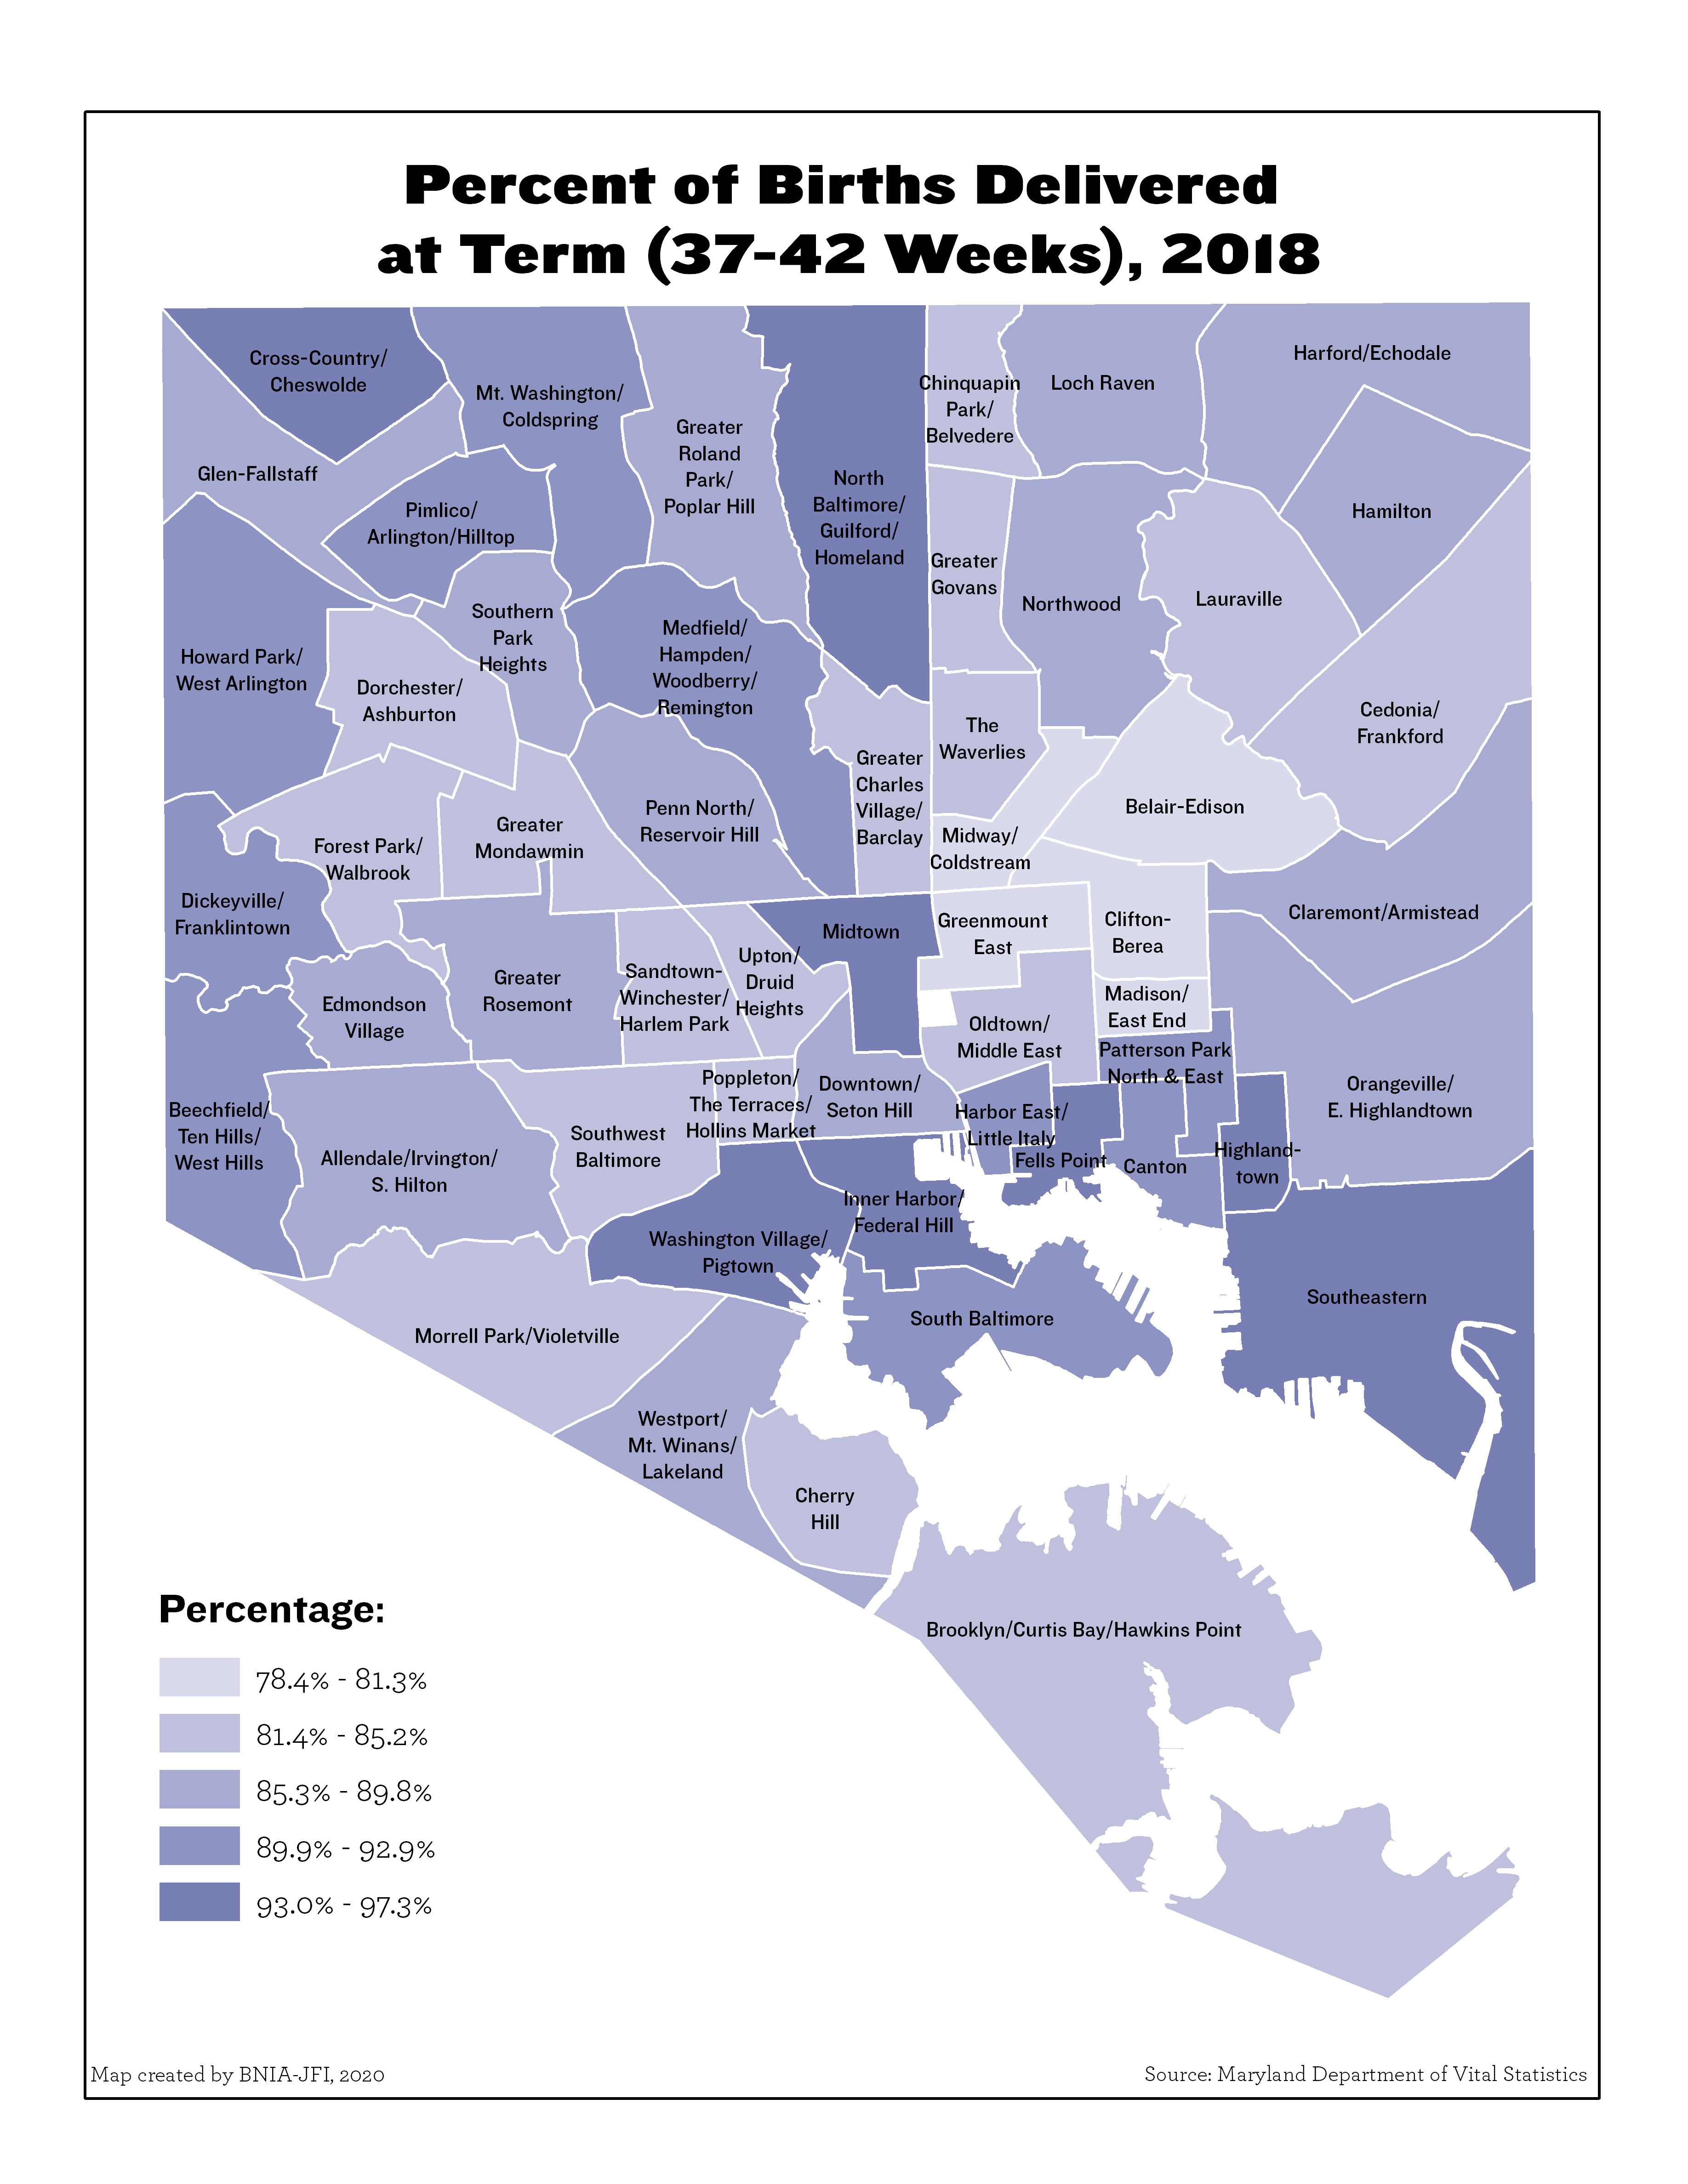
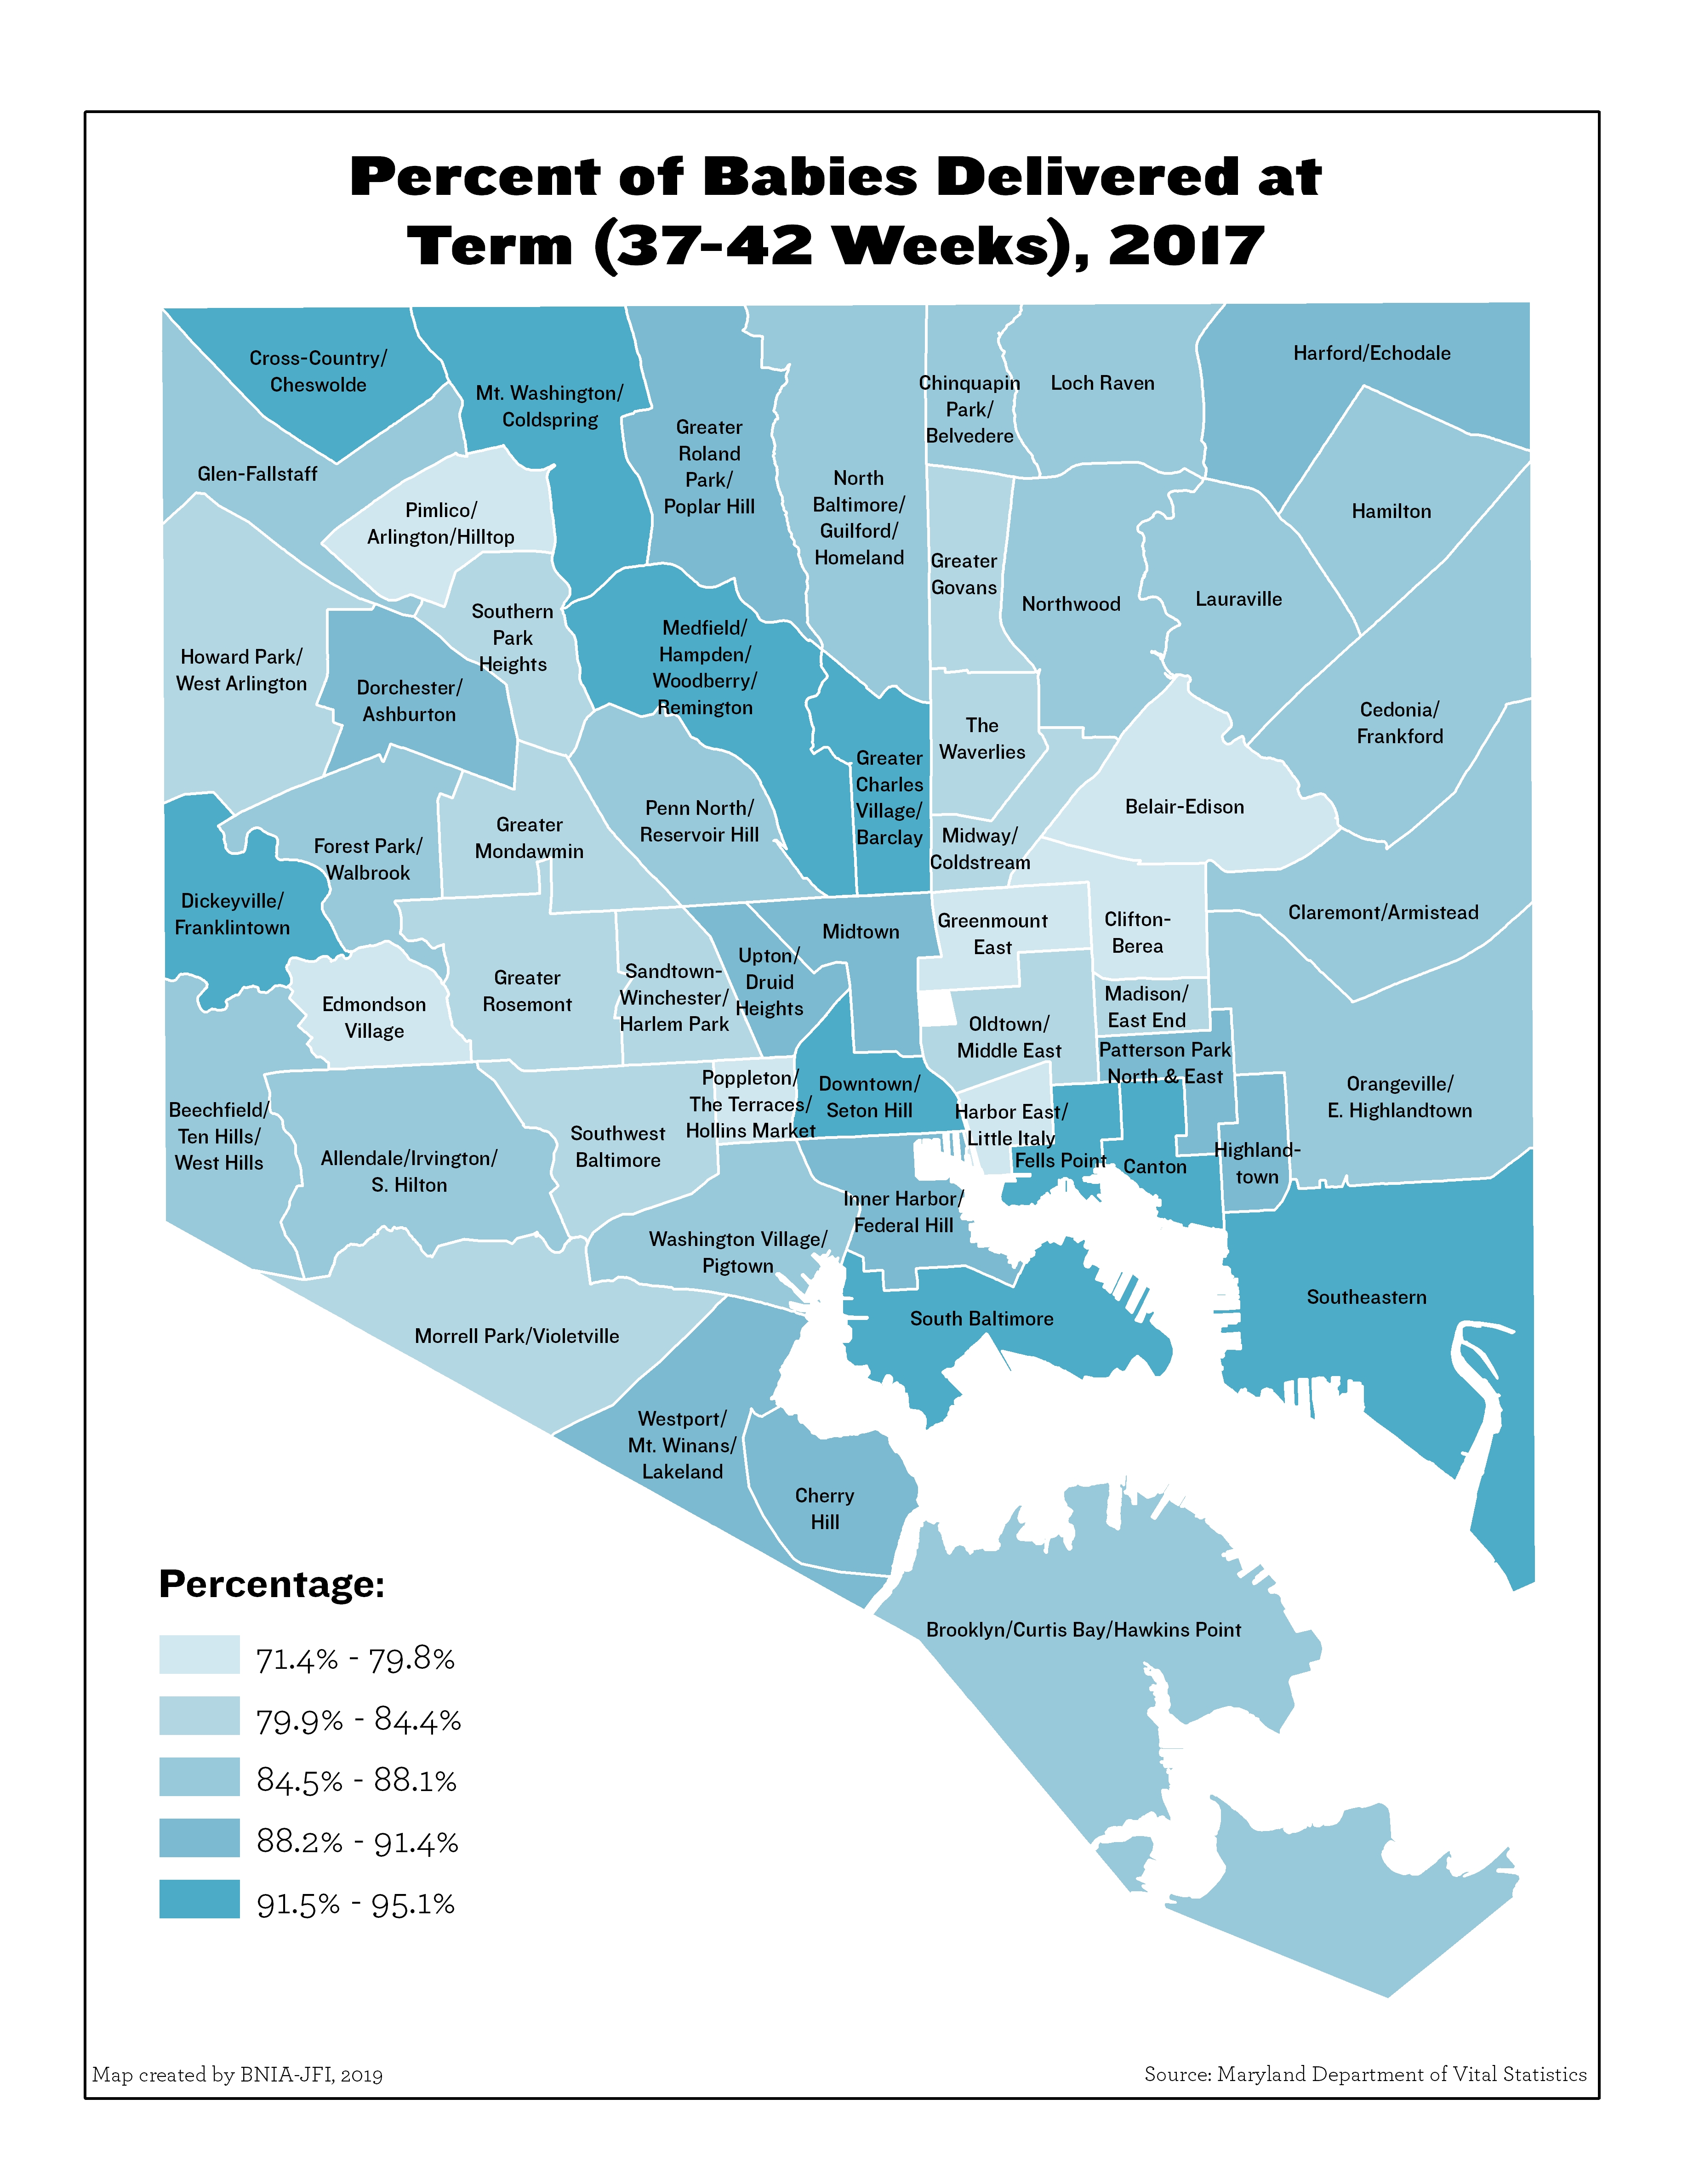
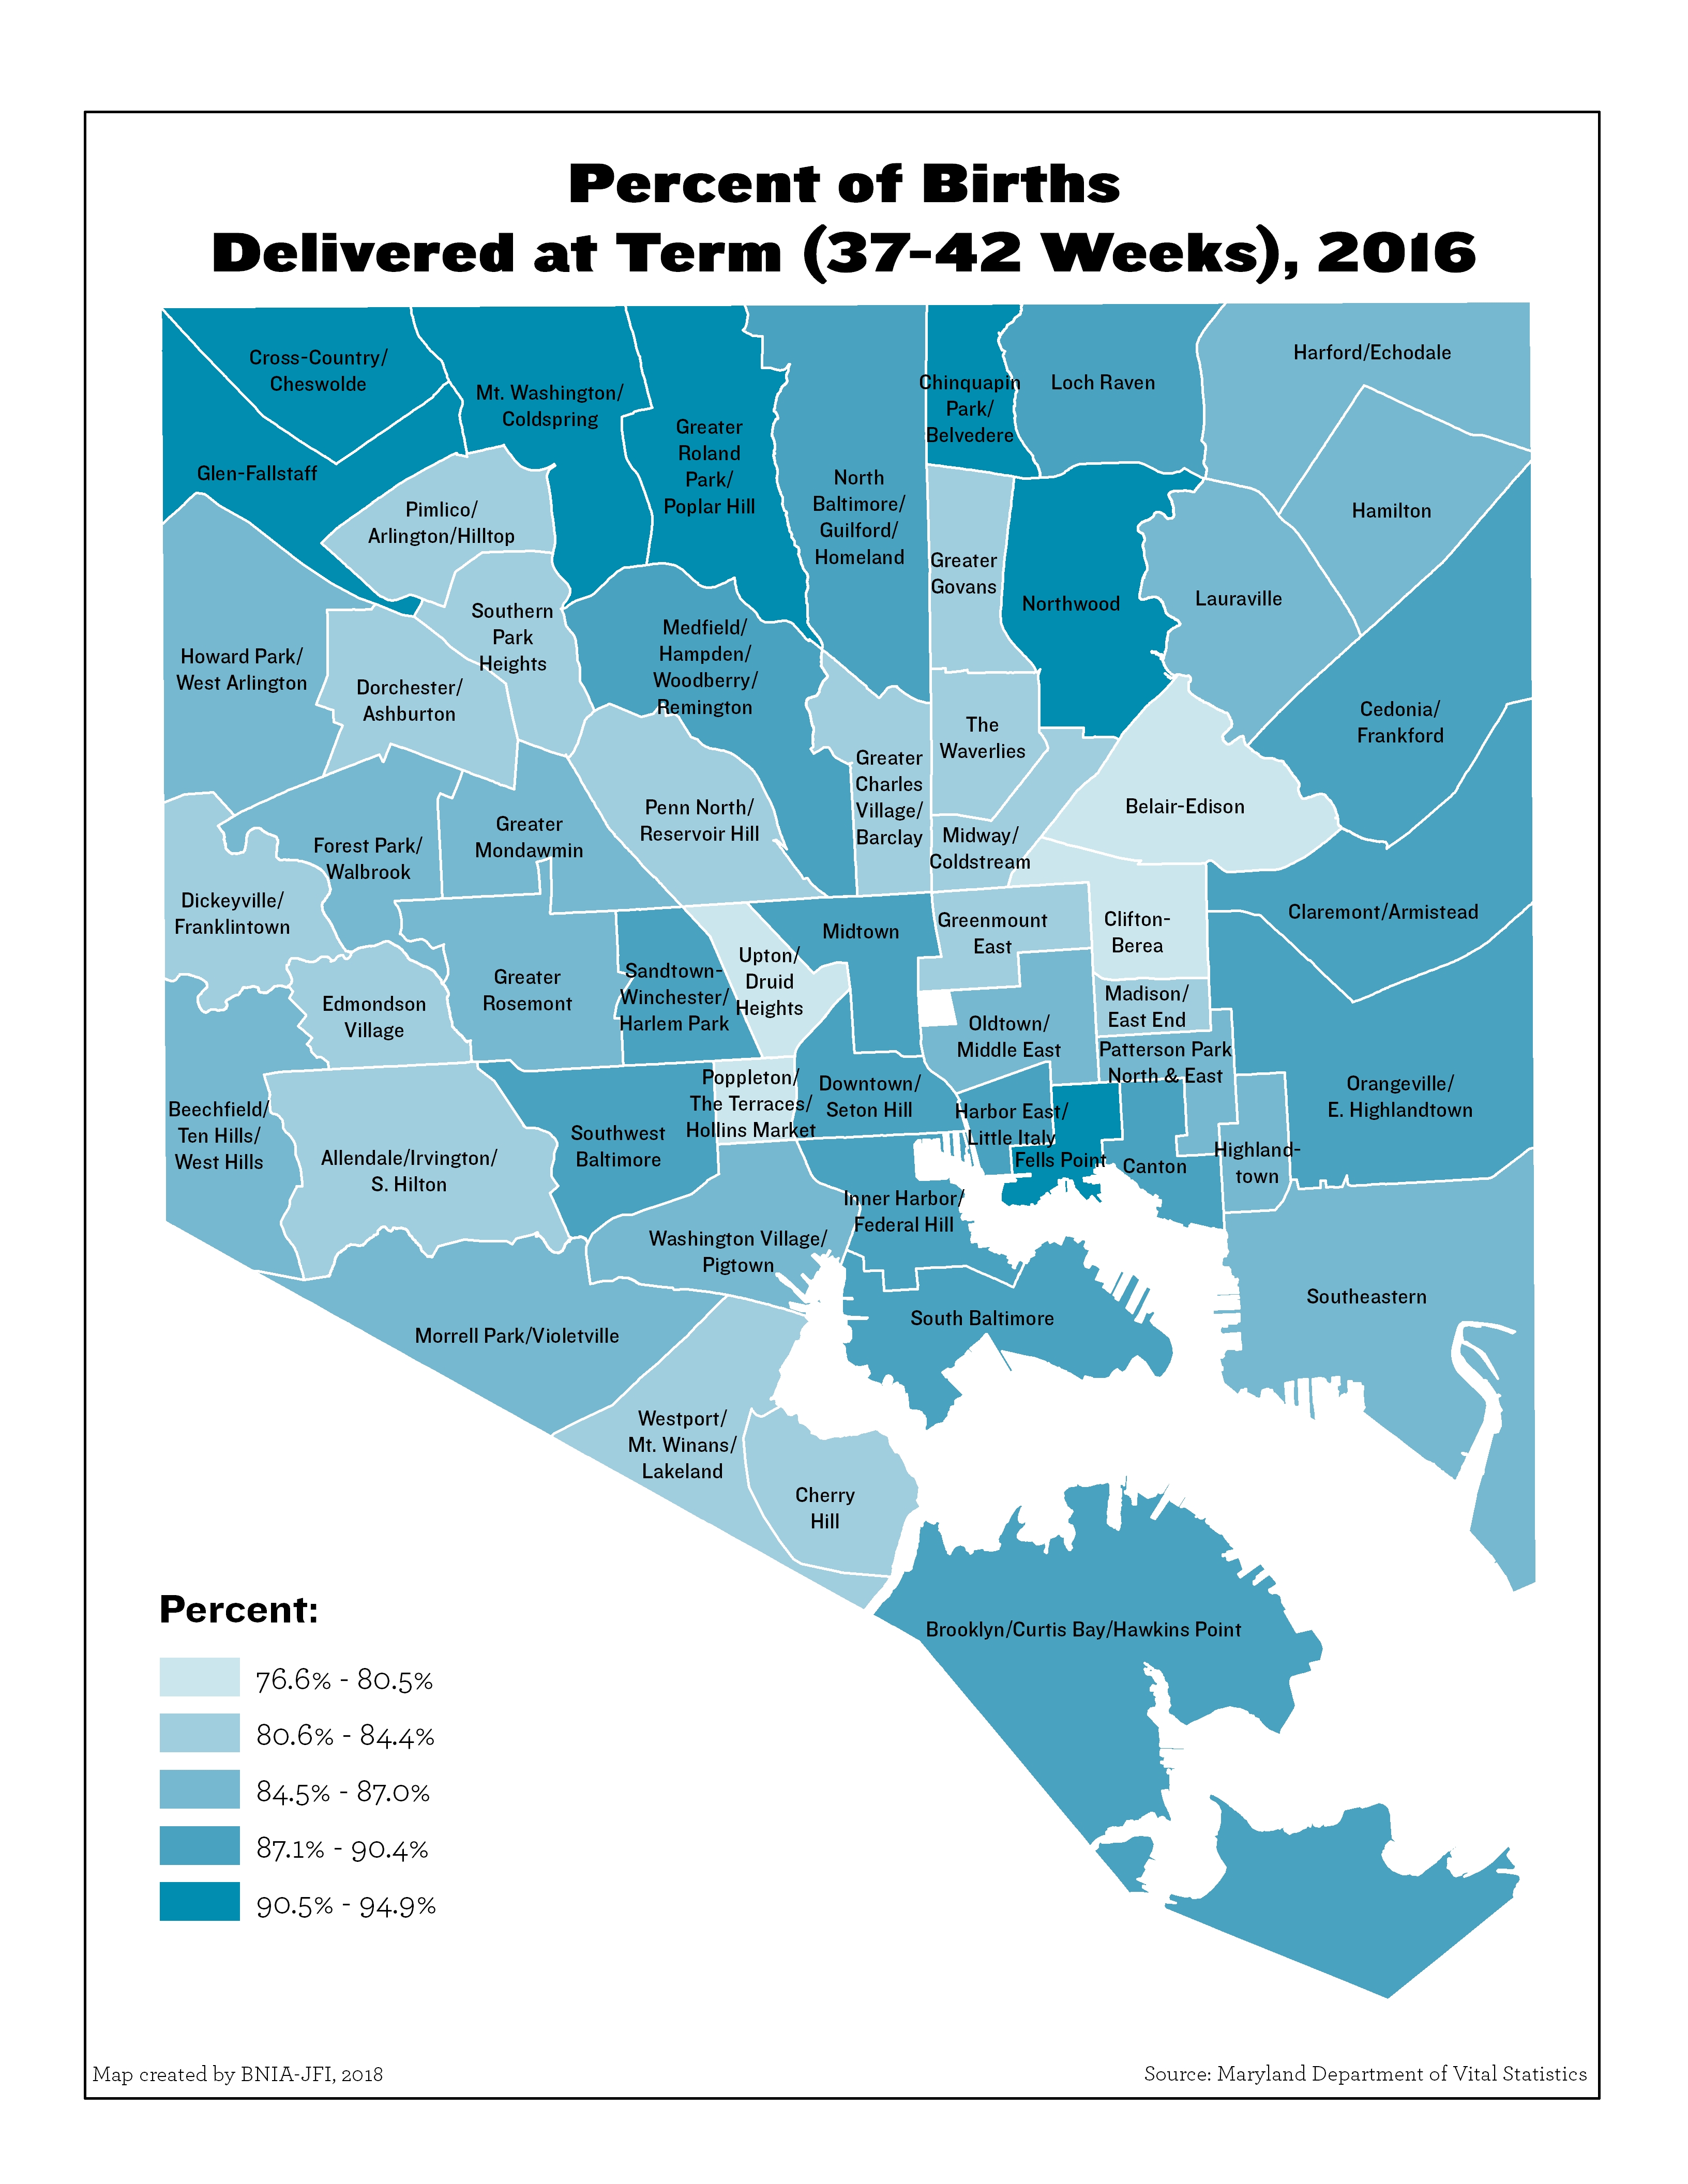
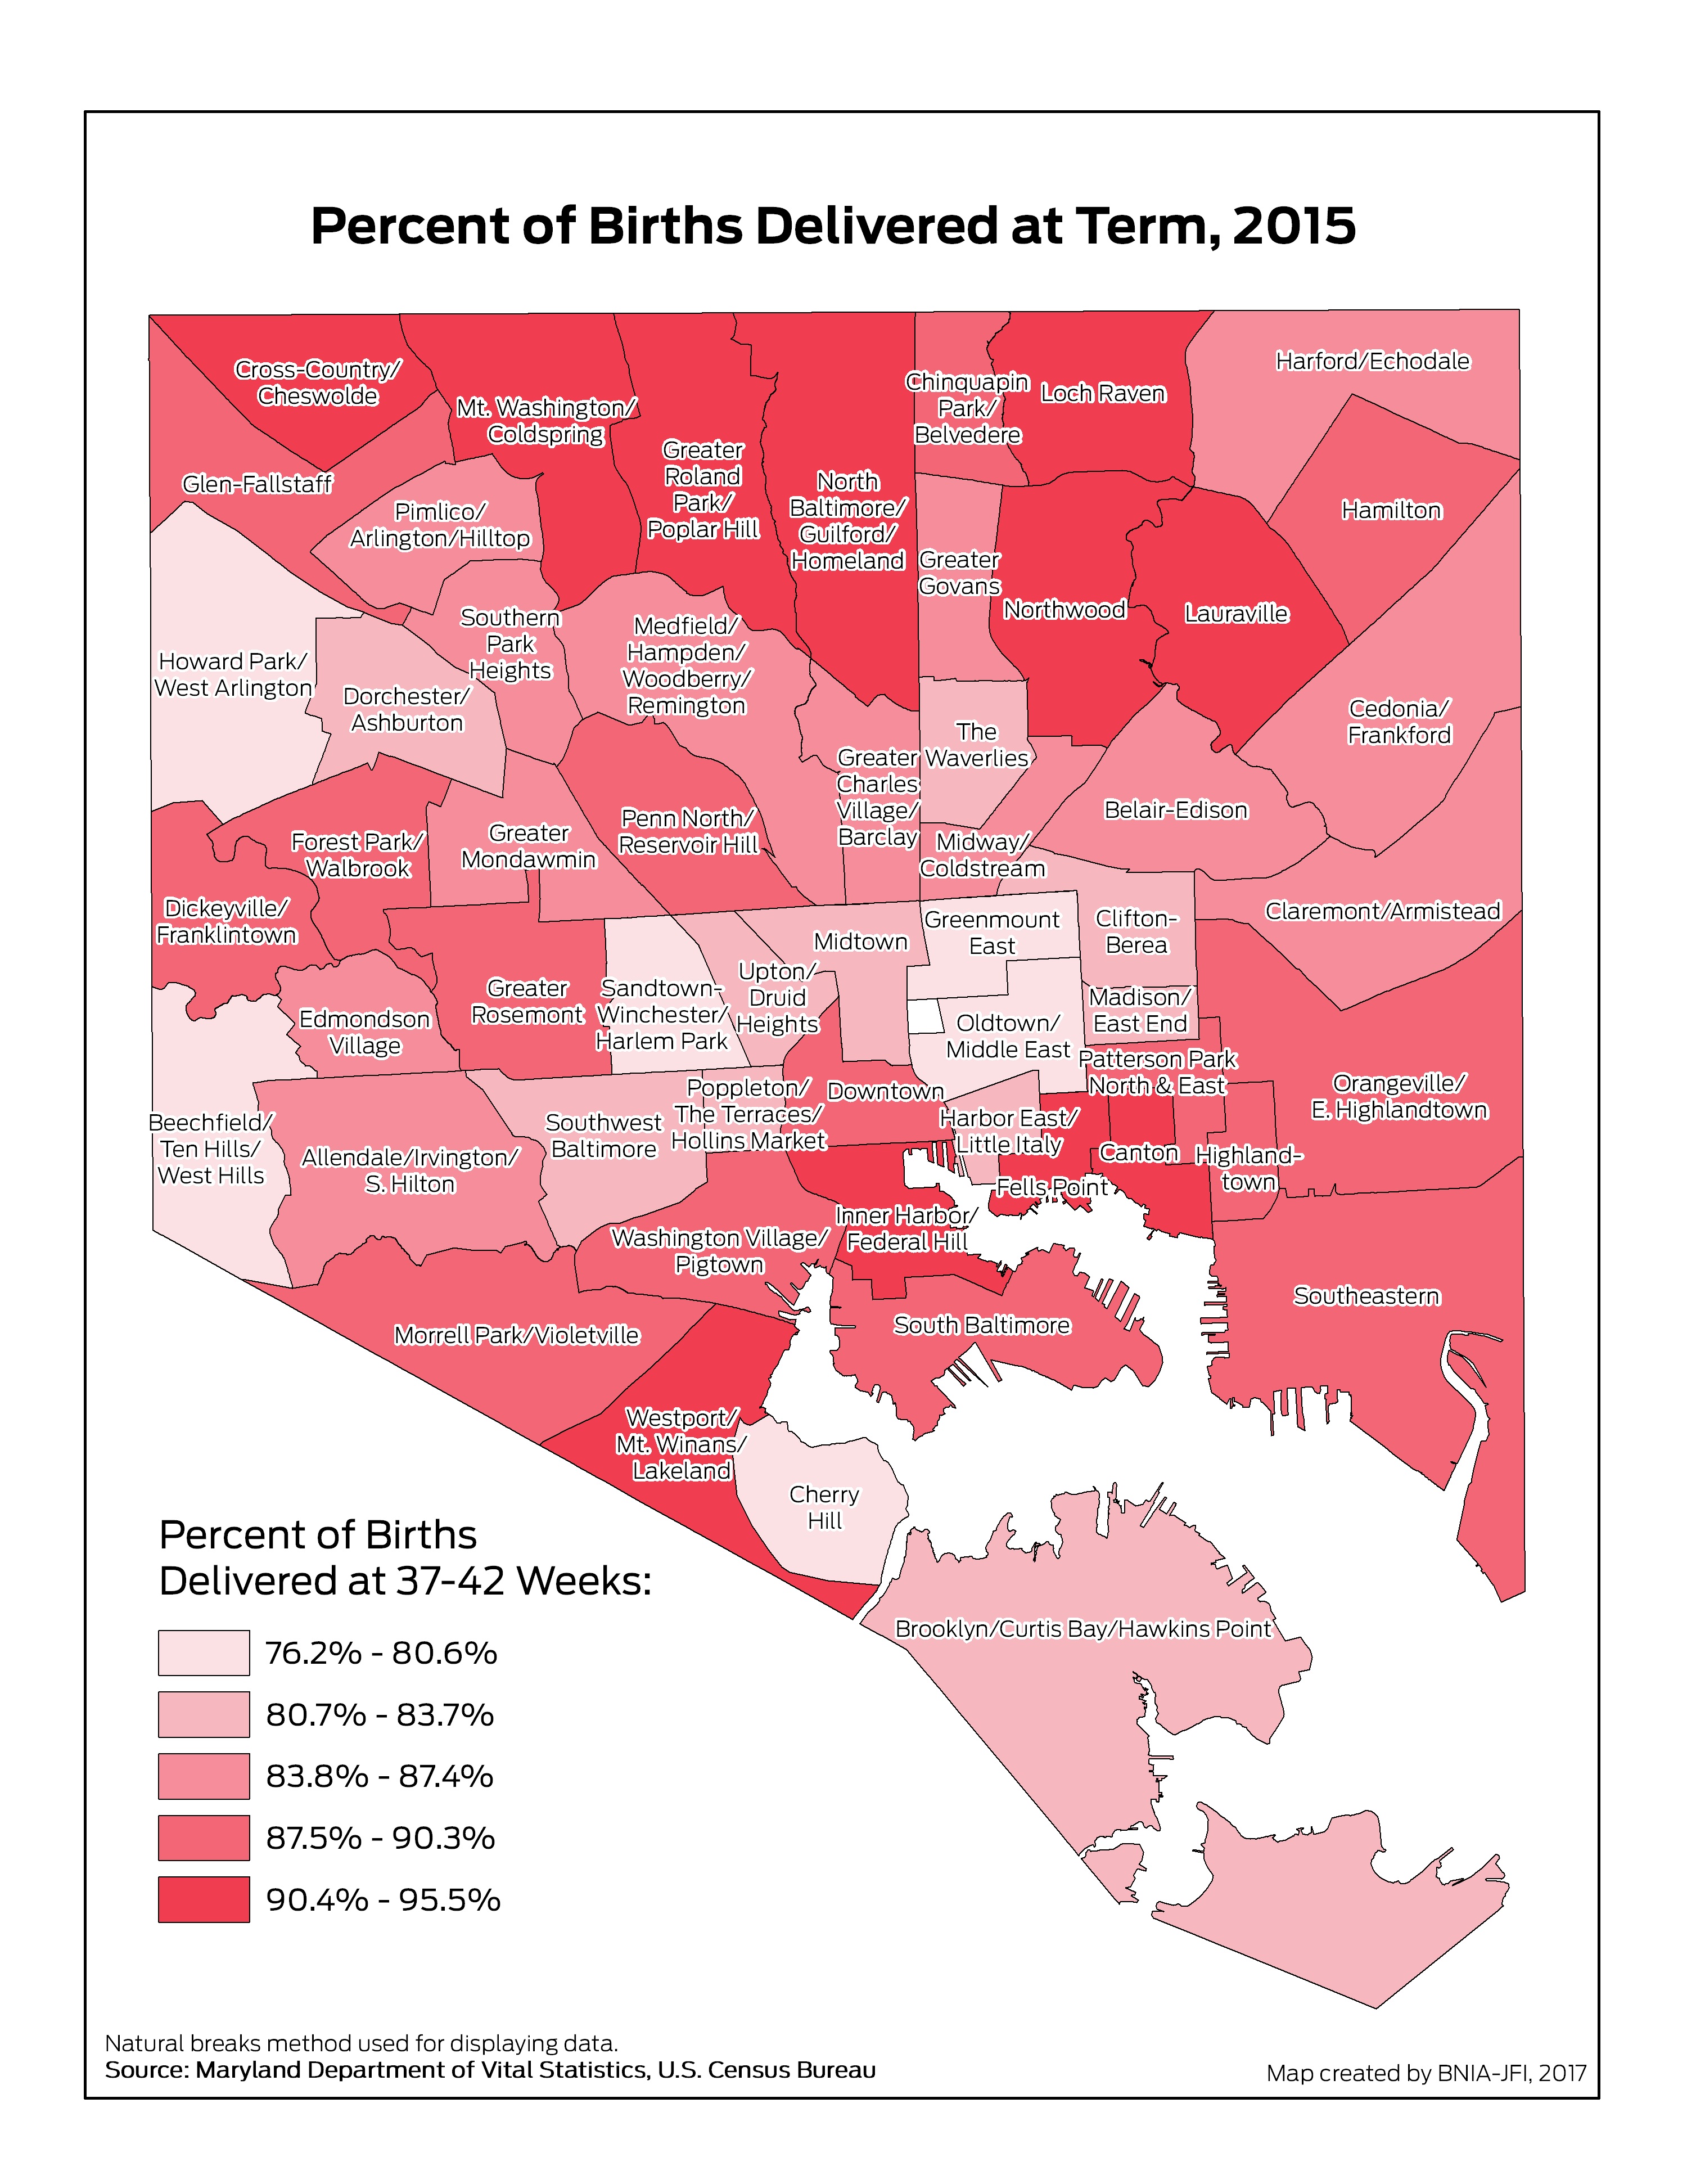
Percent of Births Delivered at Term (37-42 Weeks)
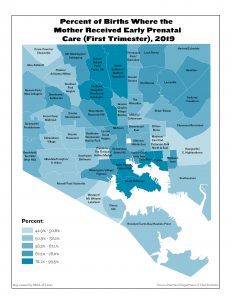
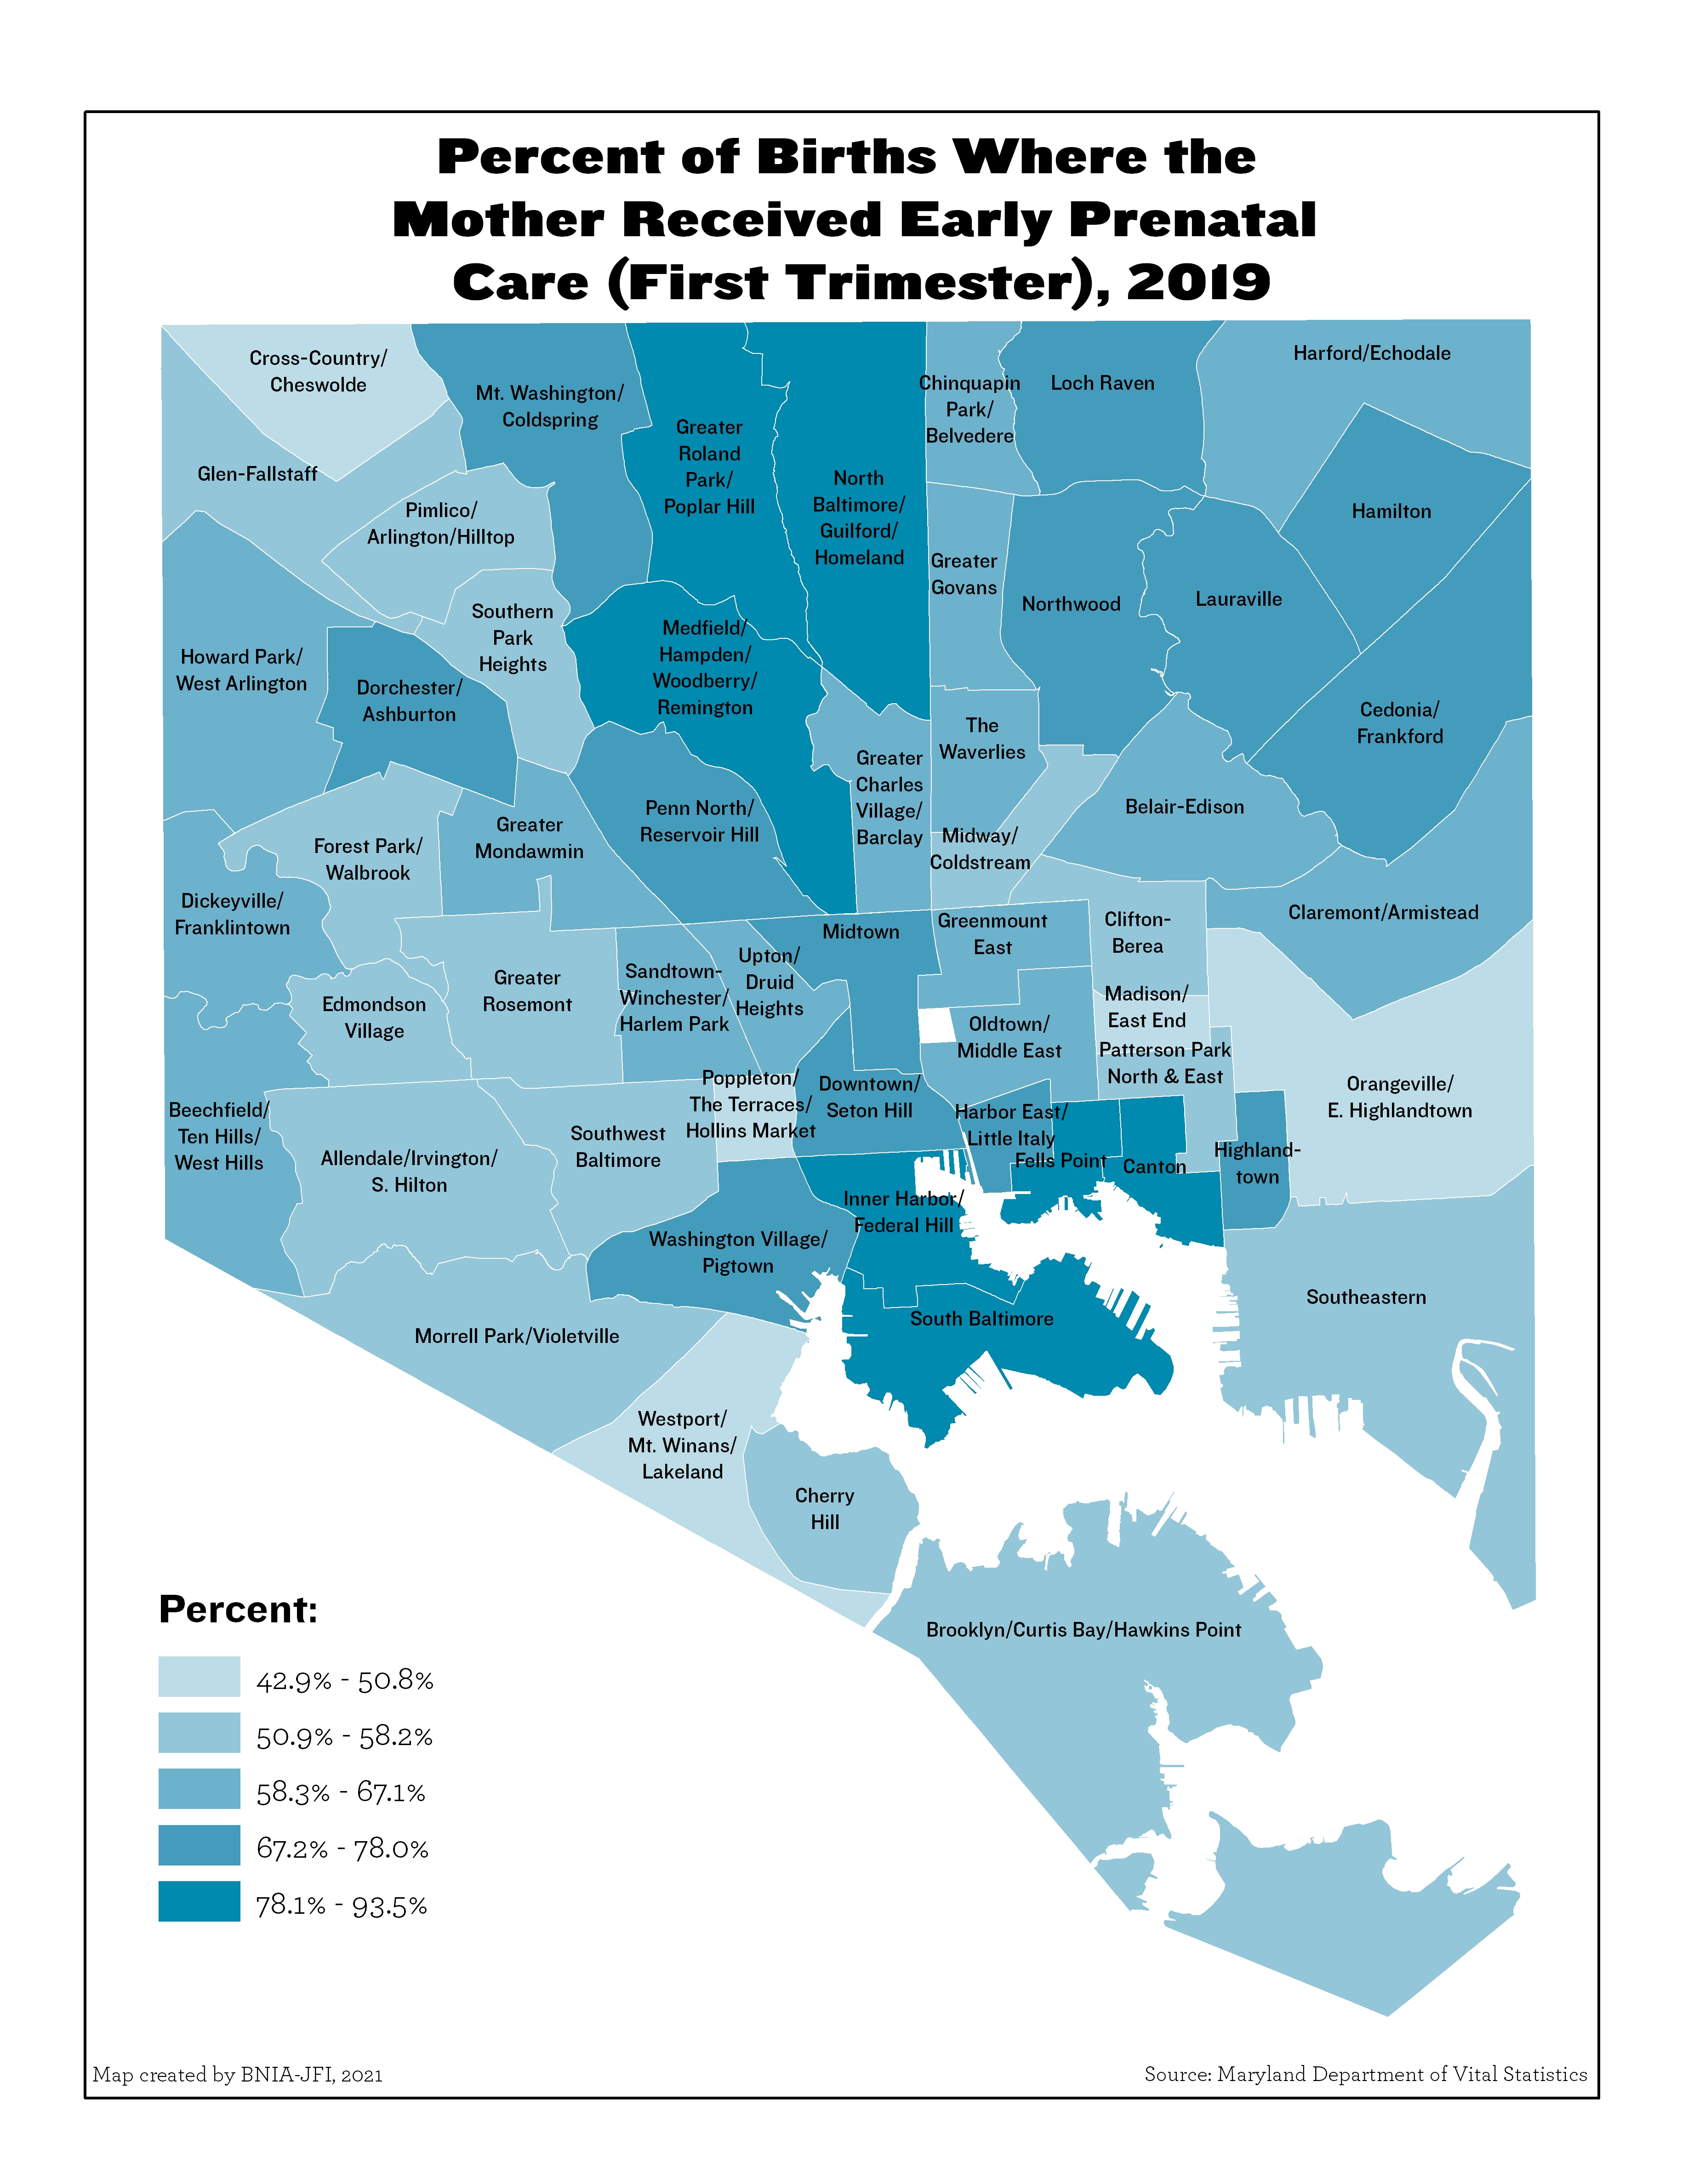
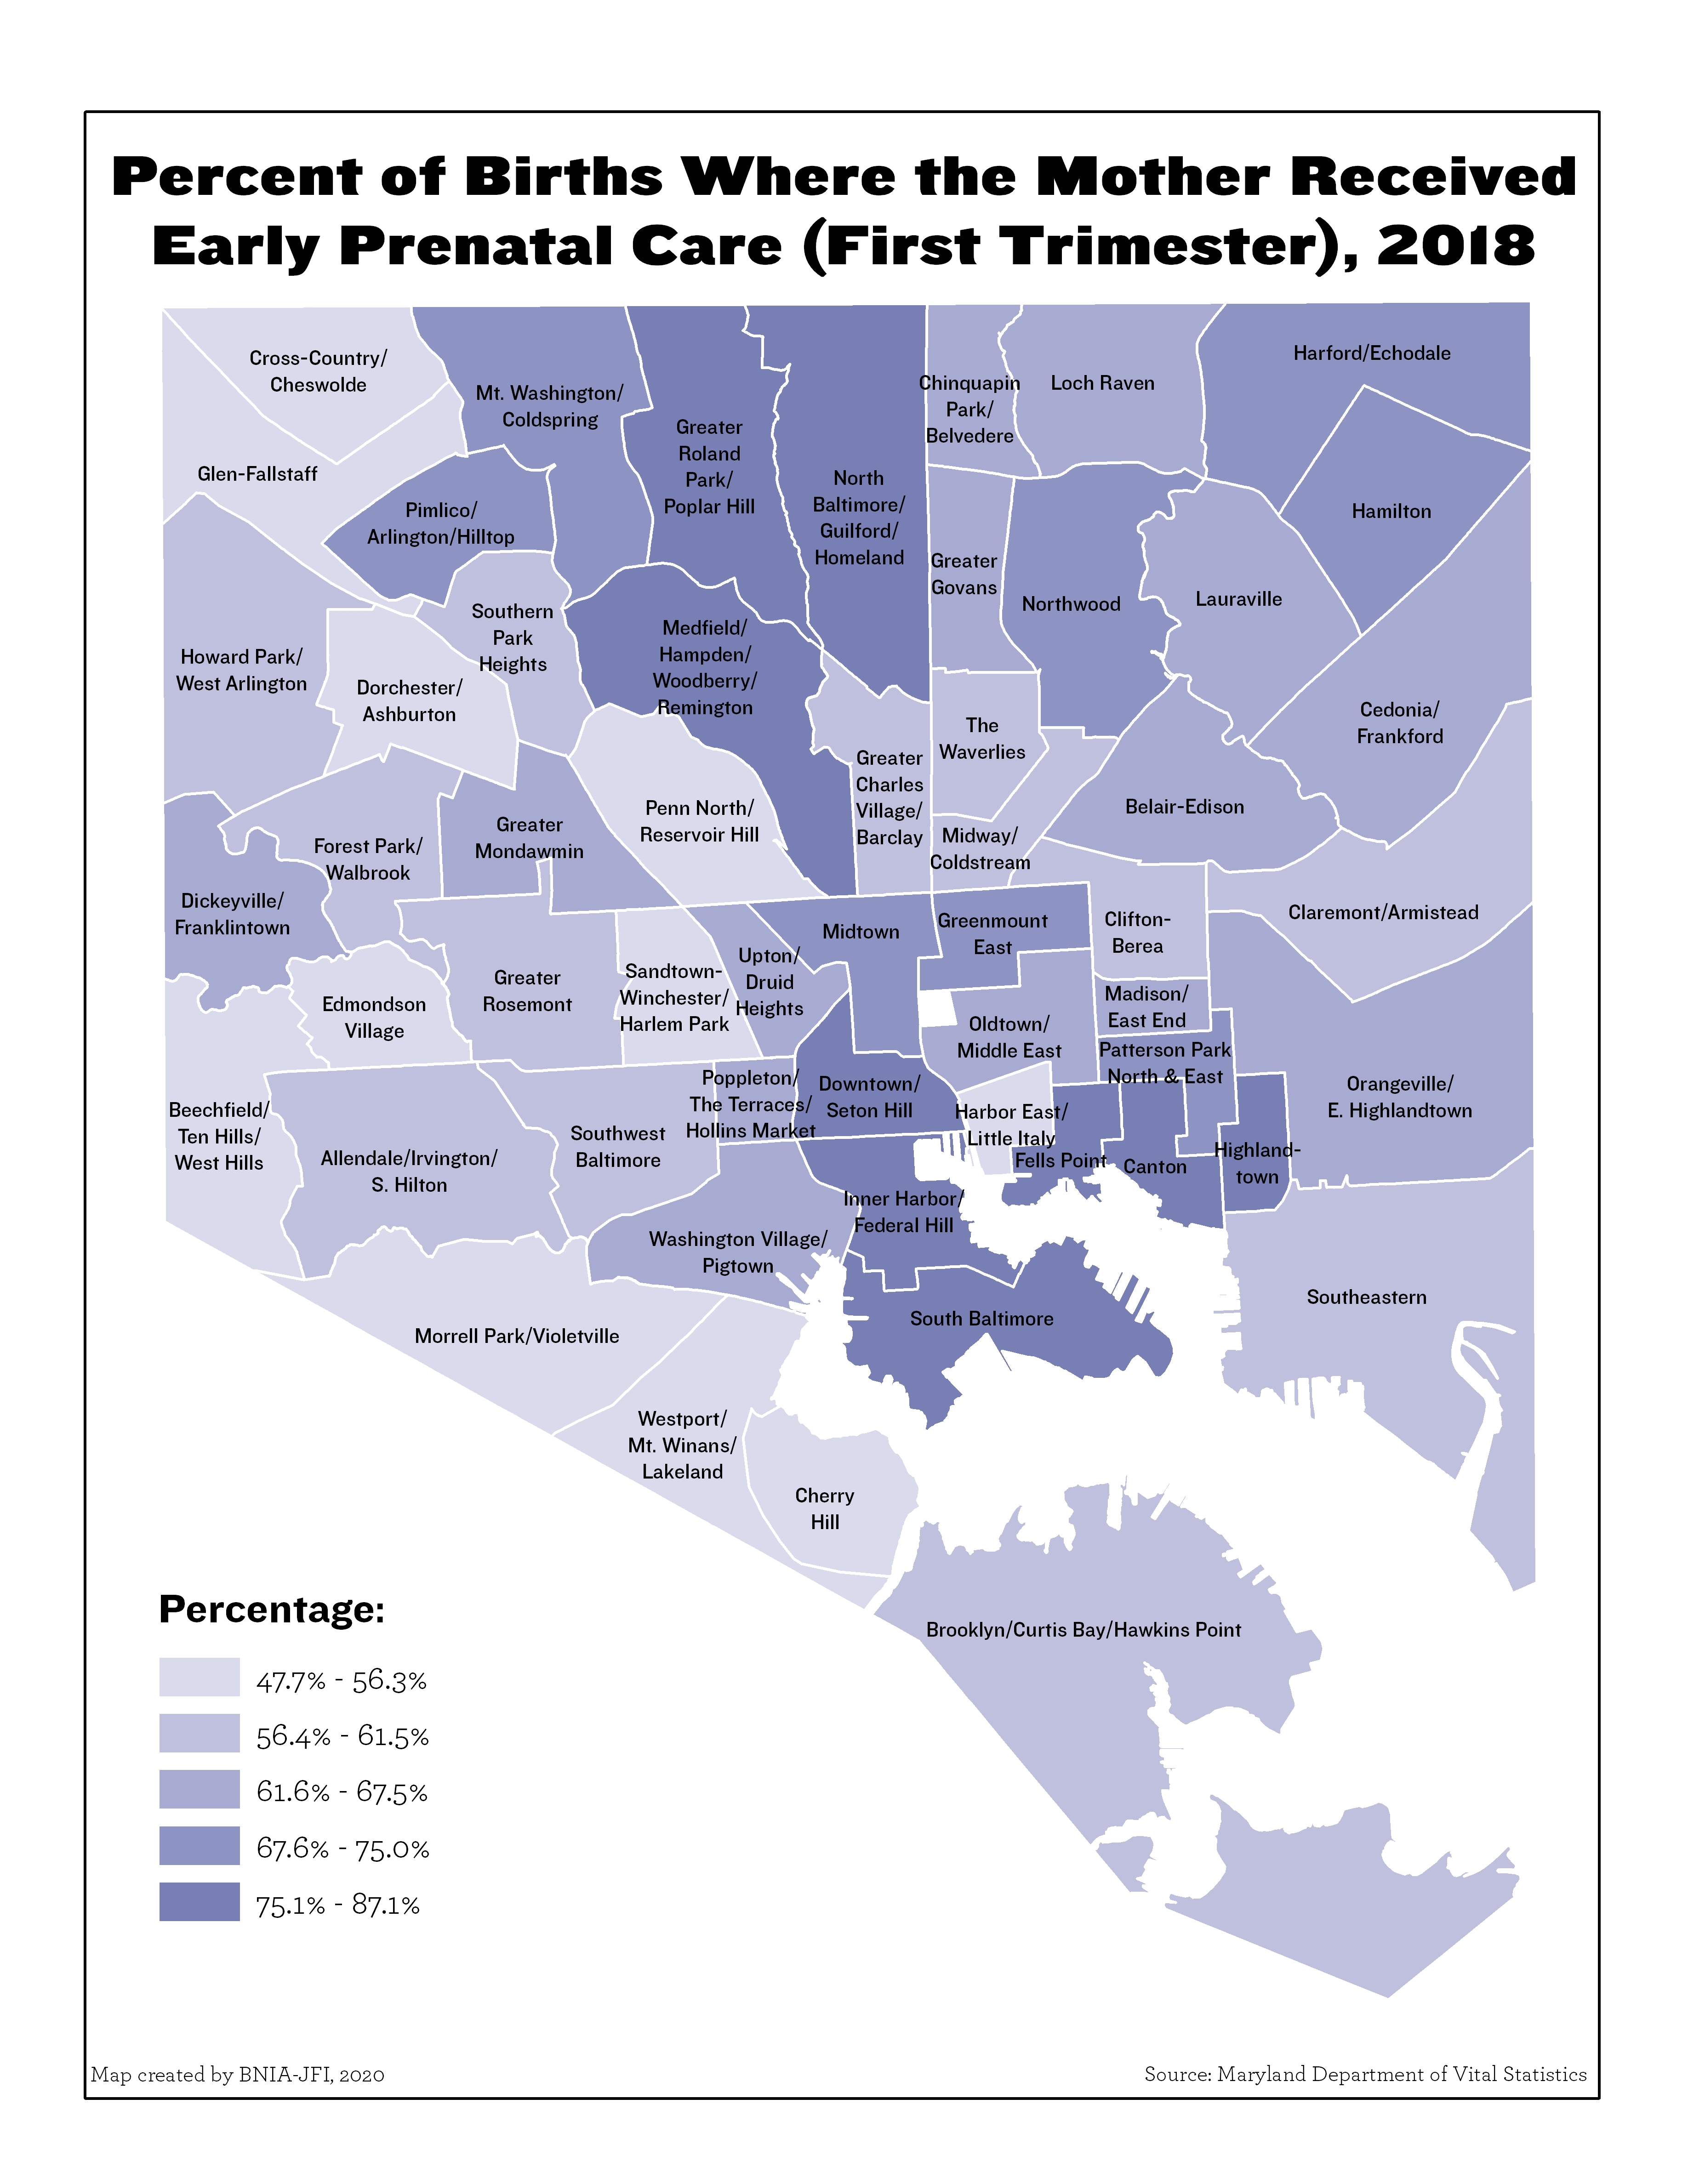
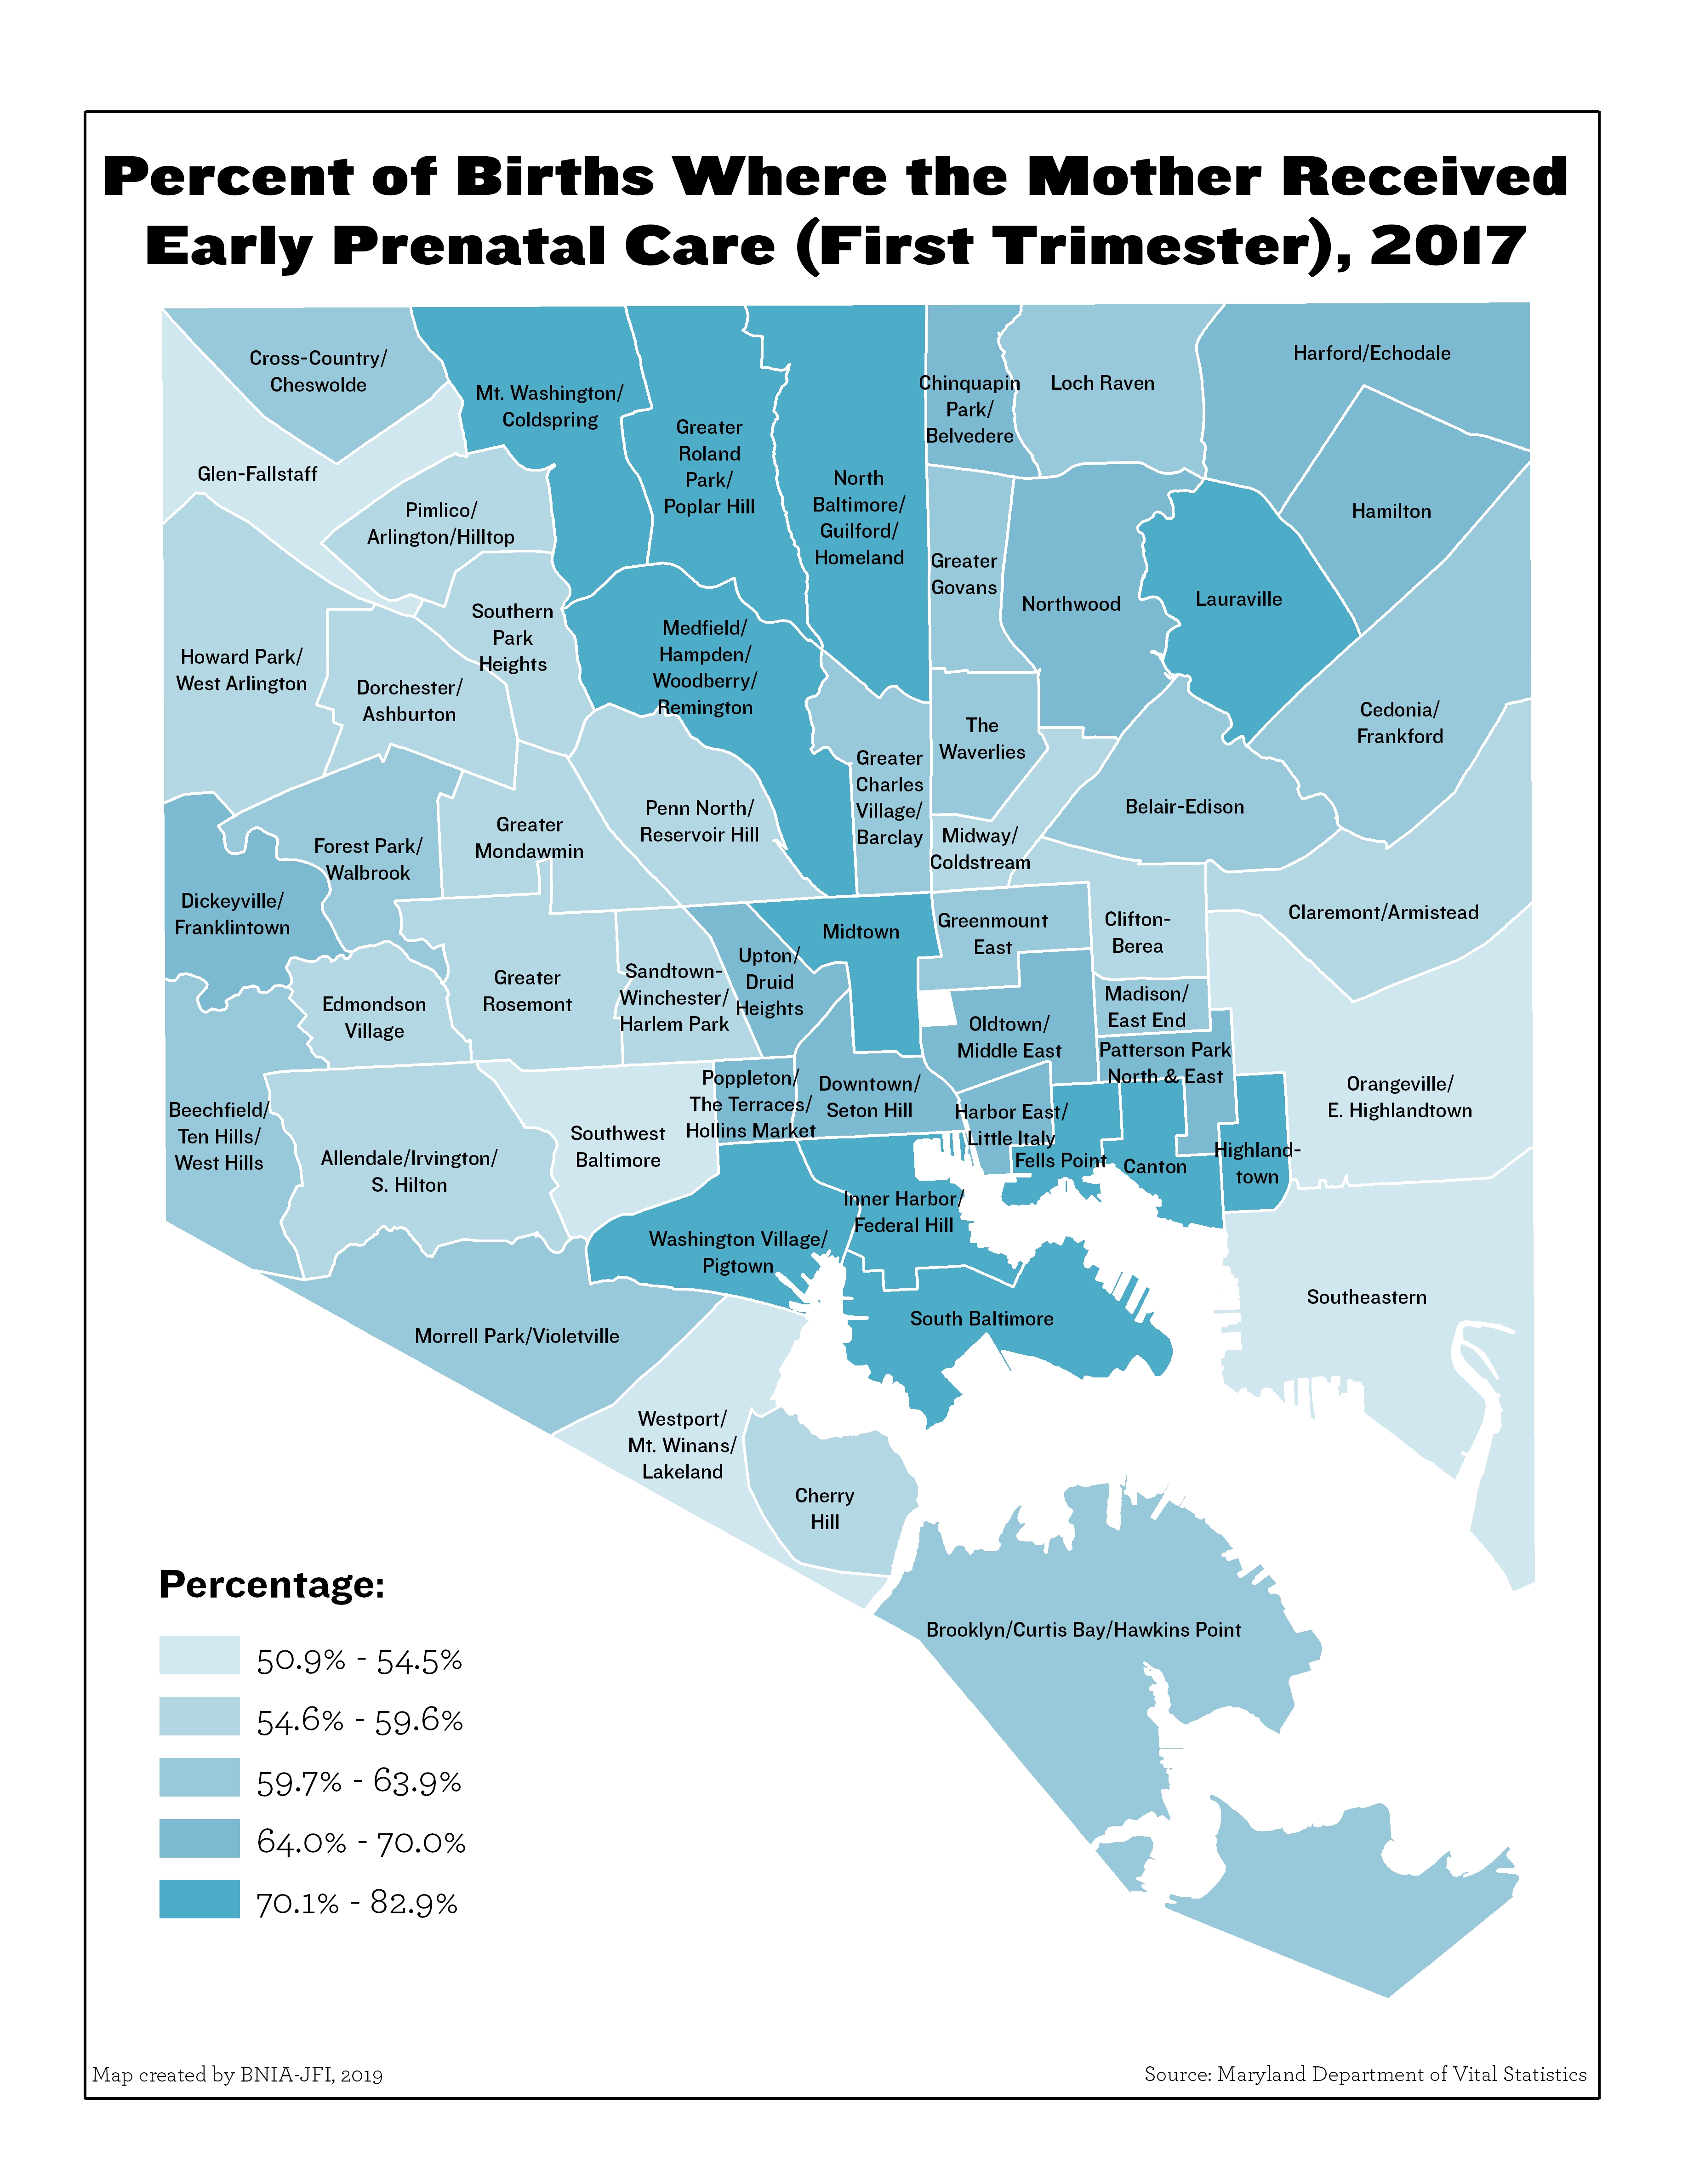
Percent of Births Where the Mother Received Early Prenatal Care (First Trimester)
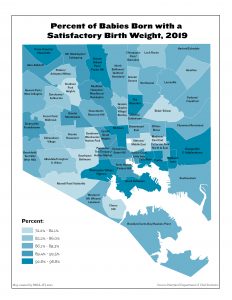
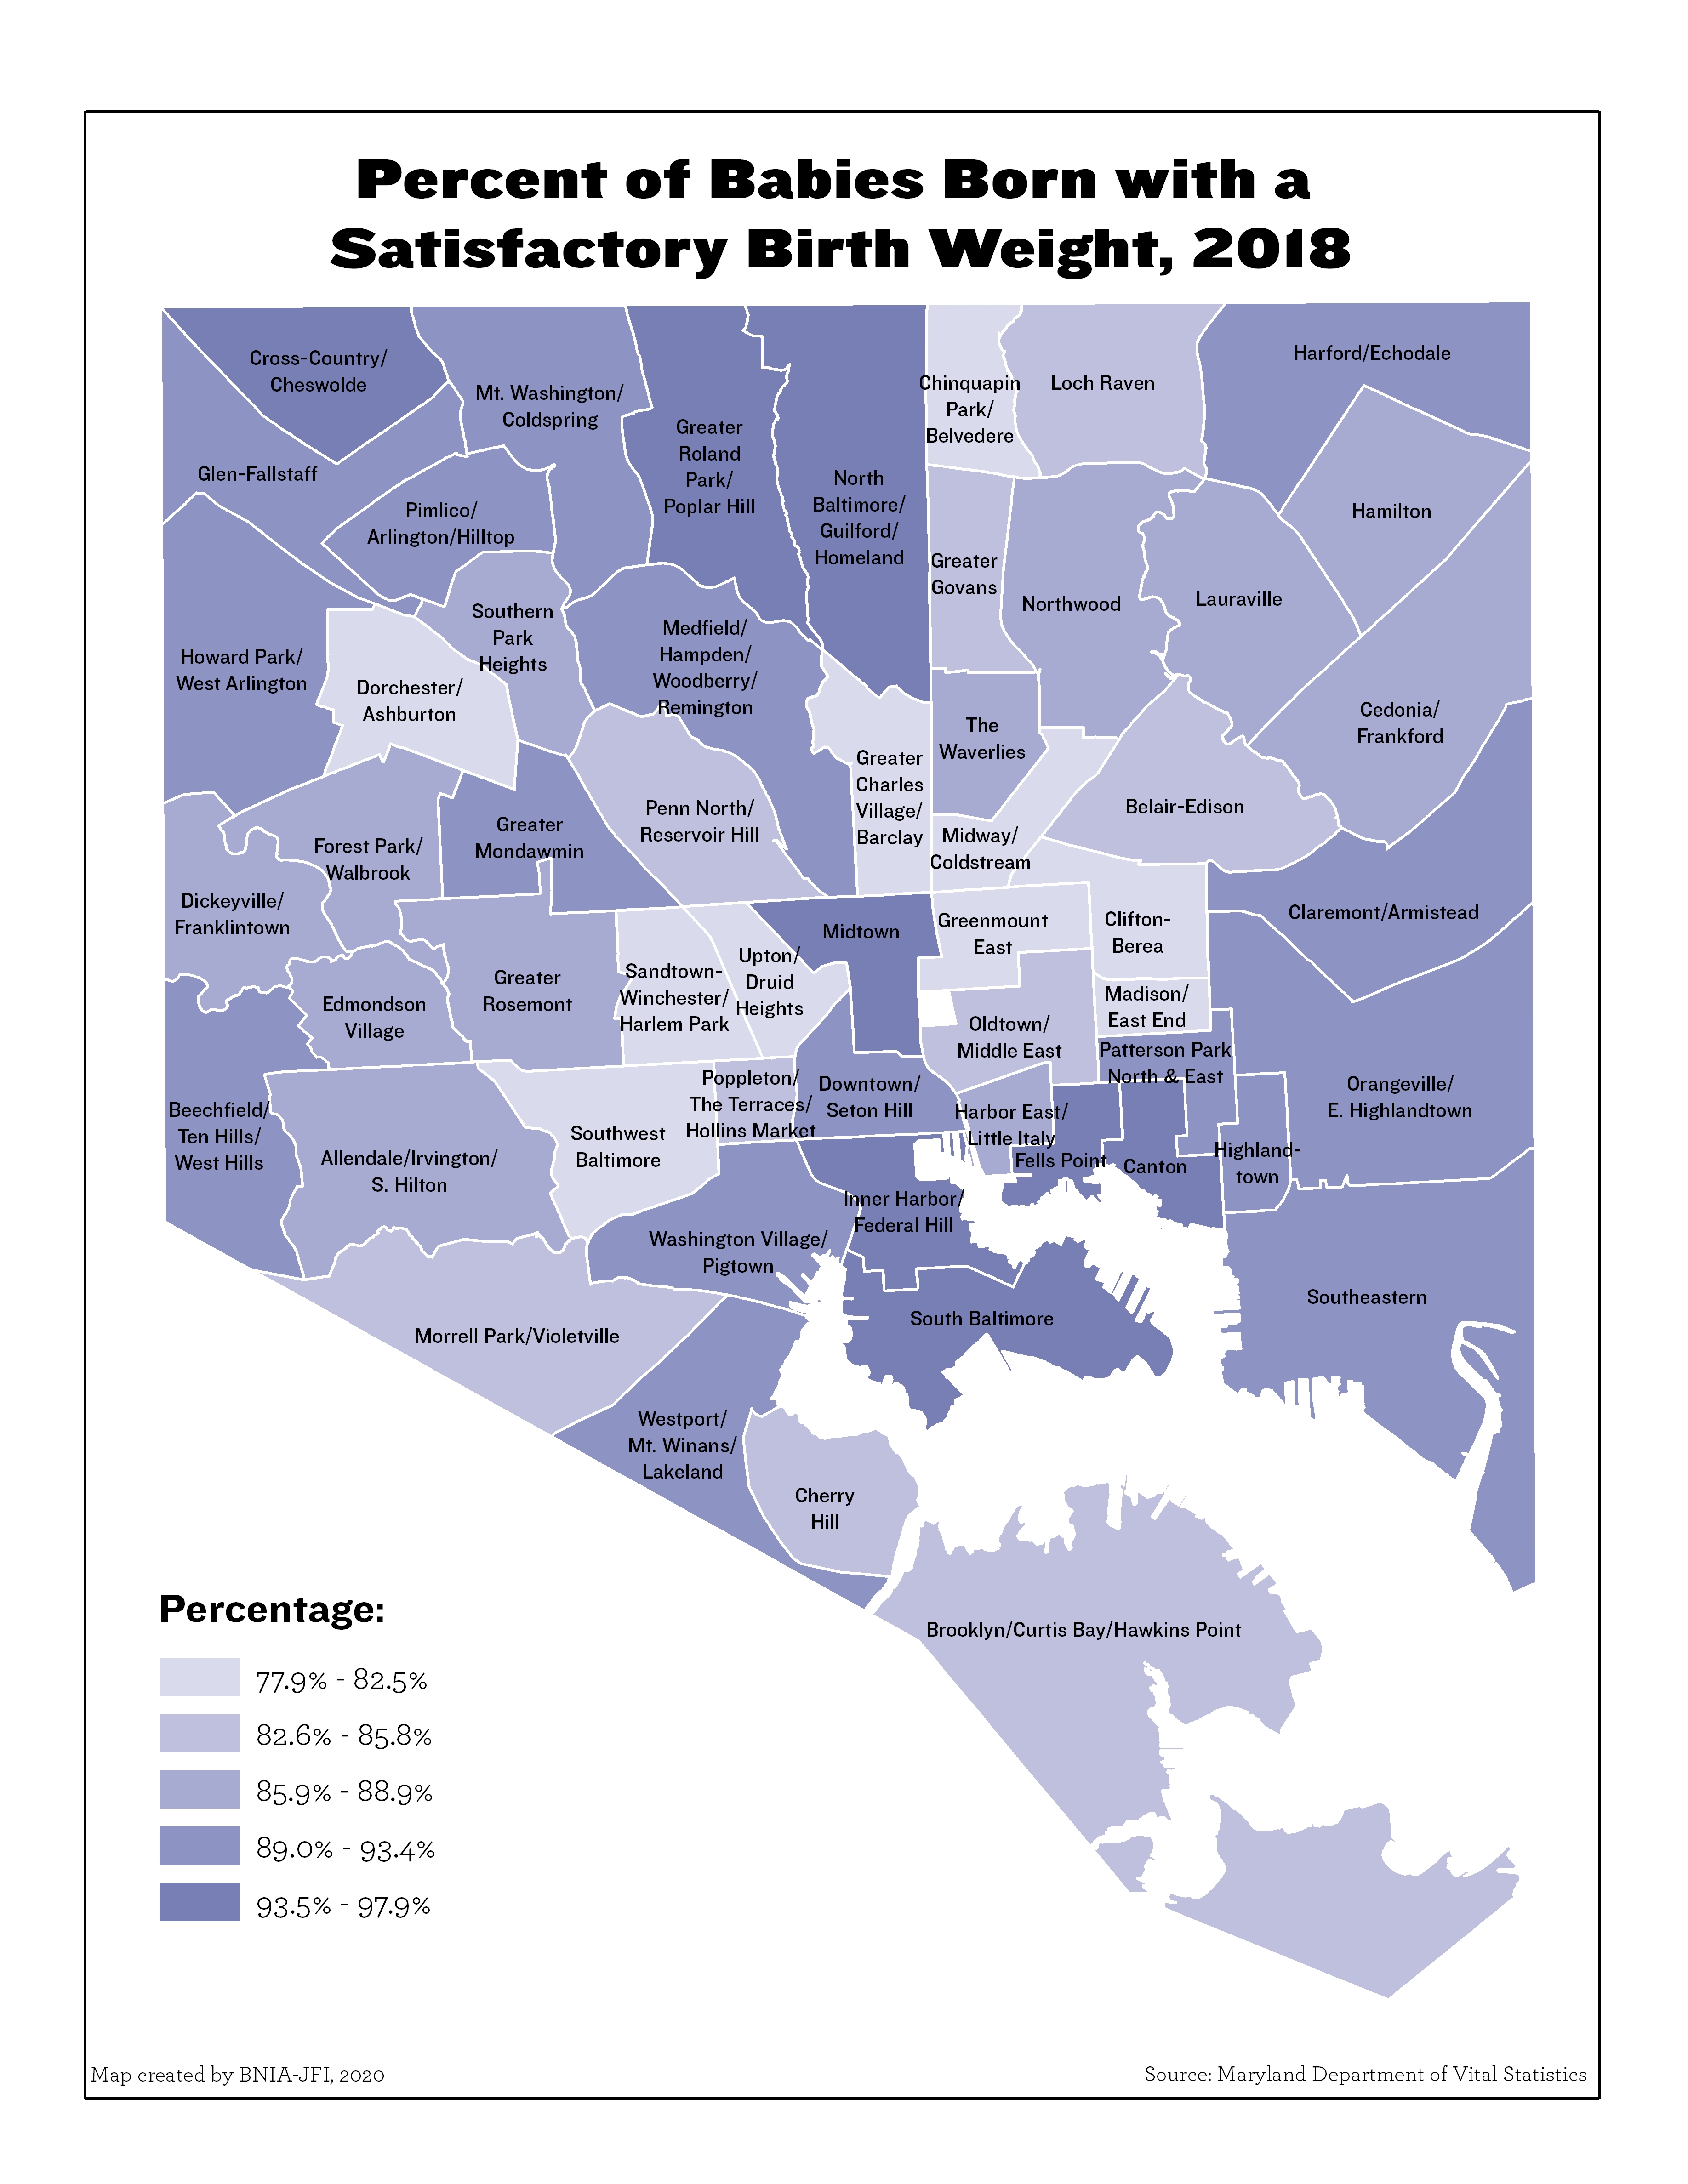
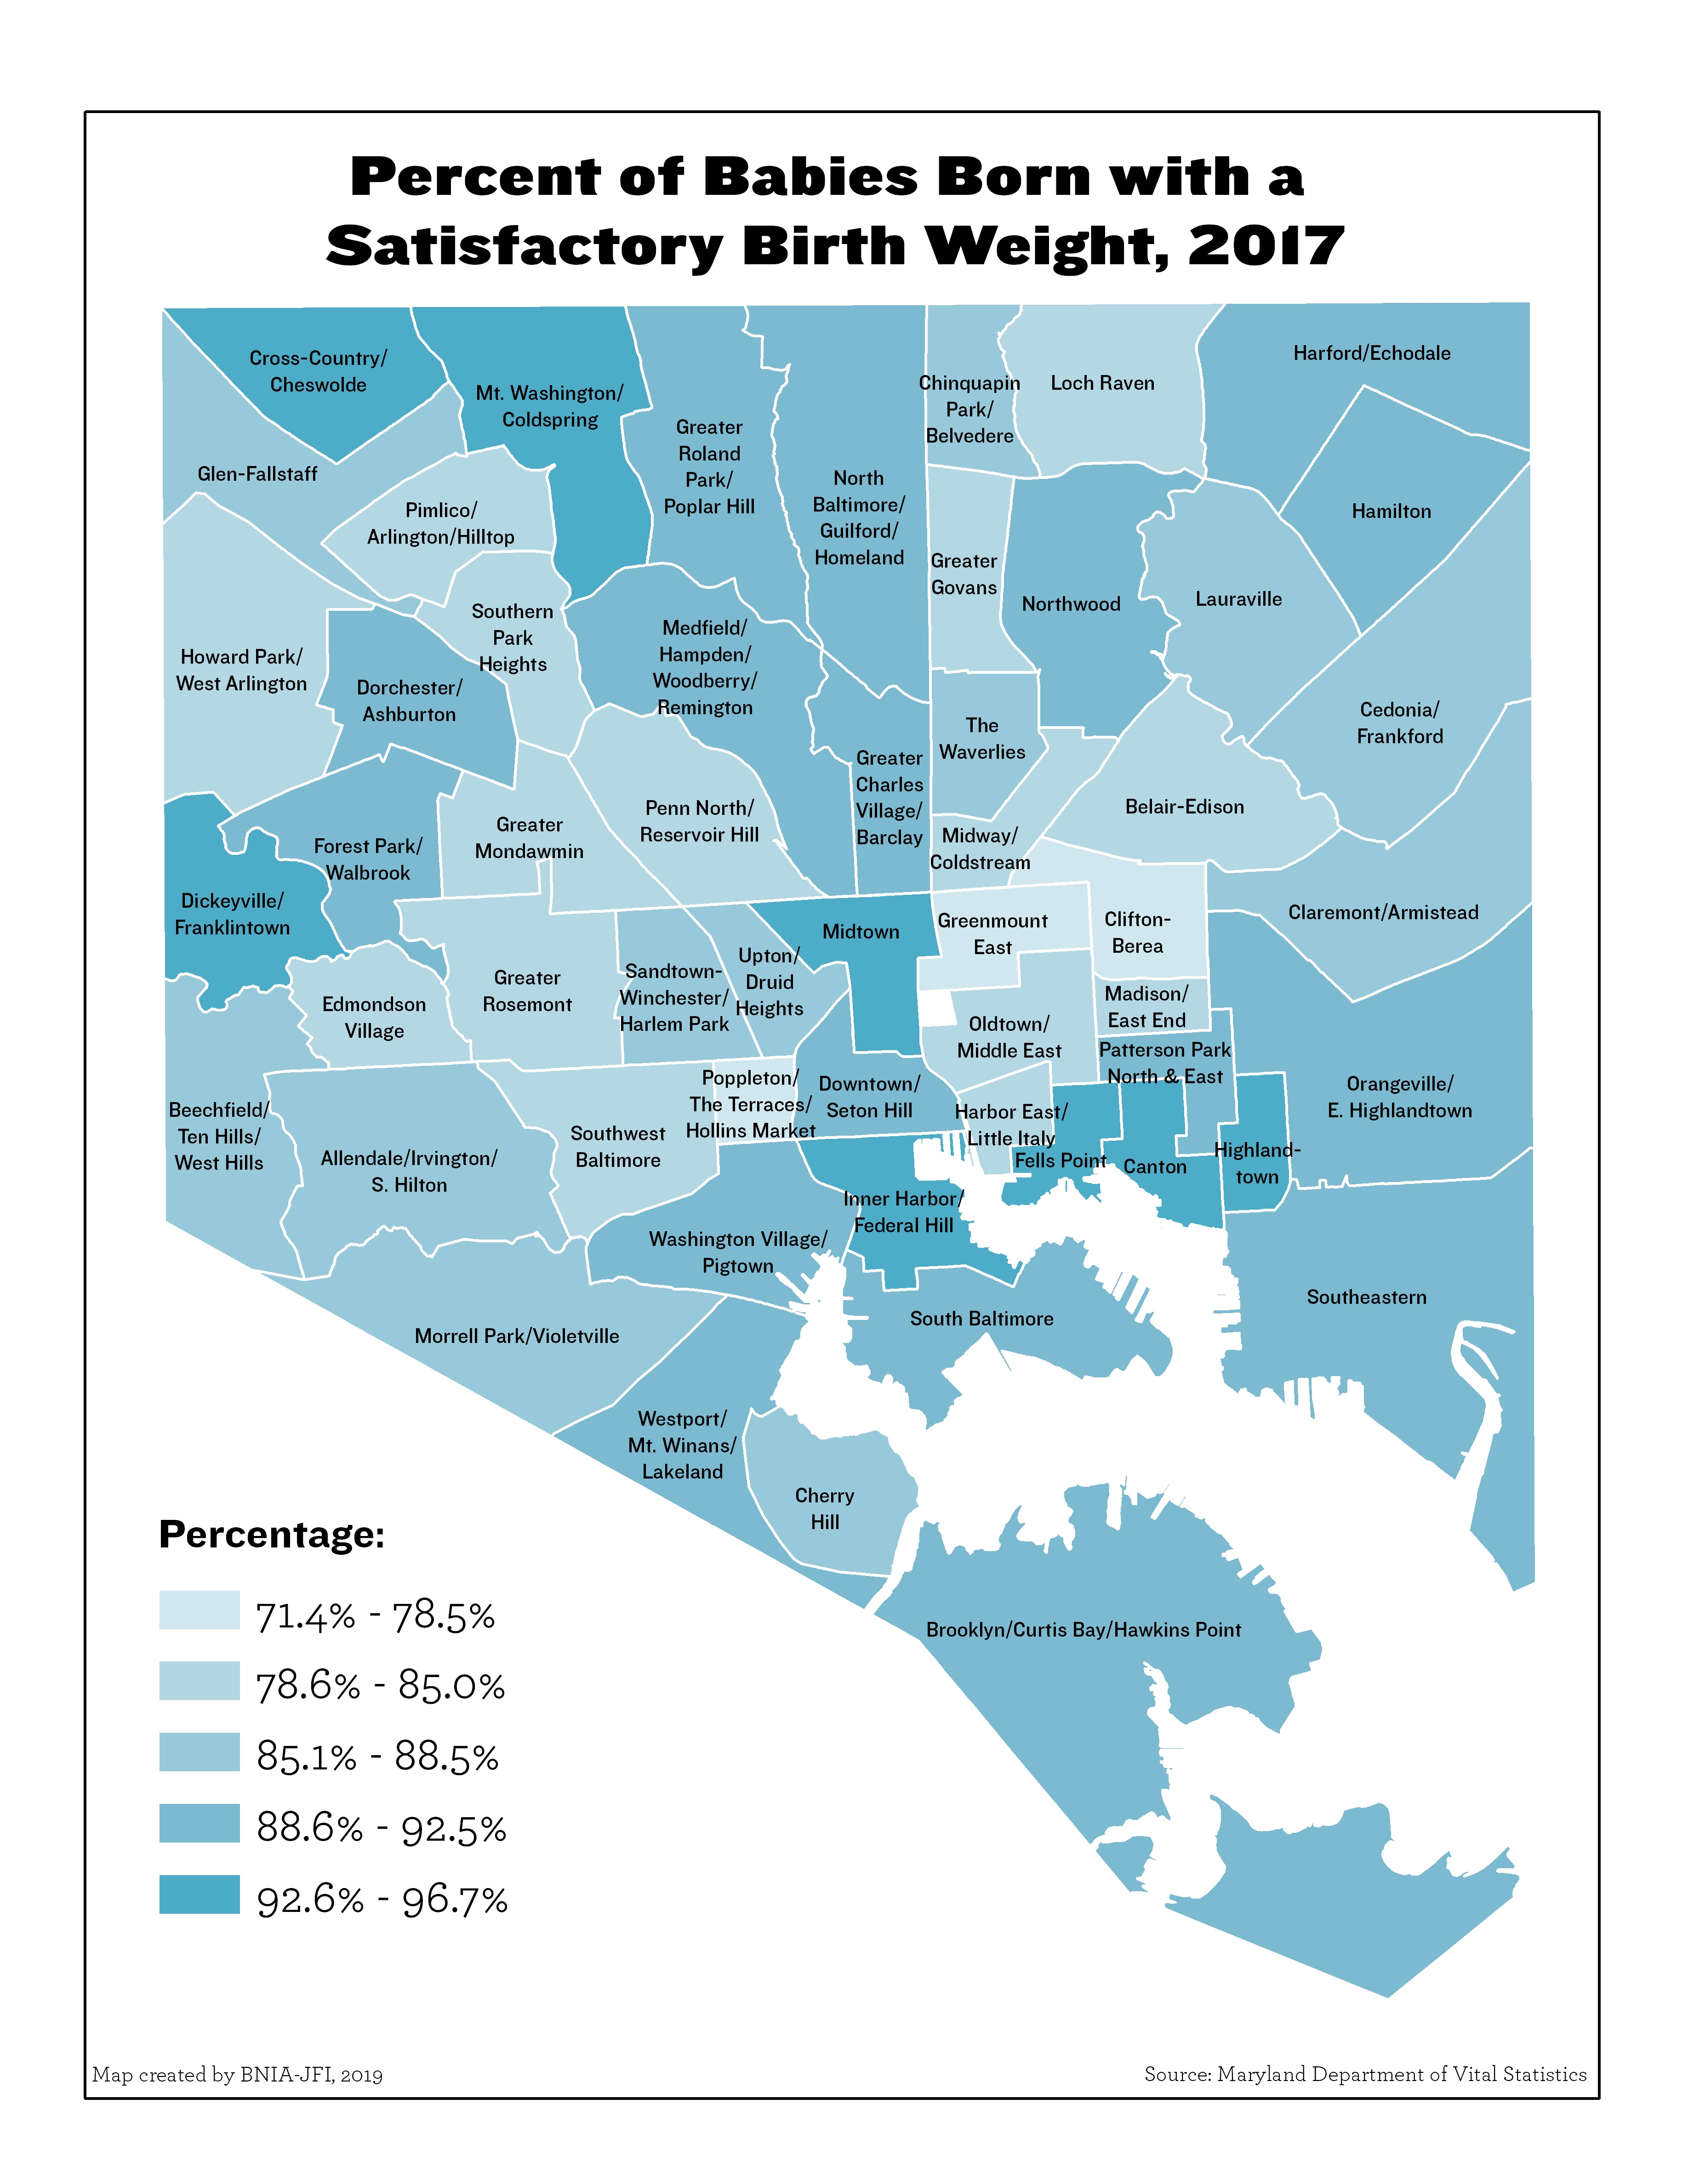
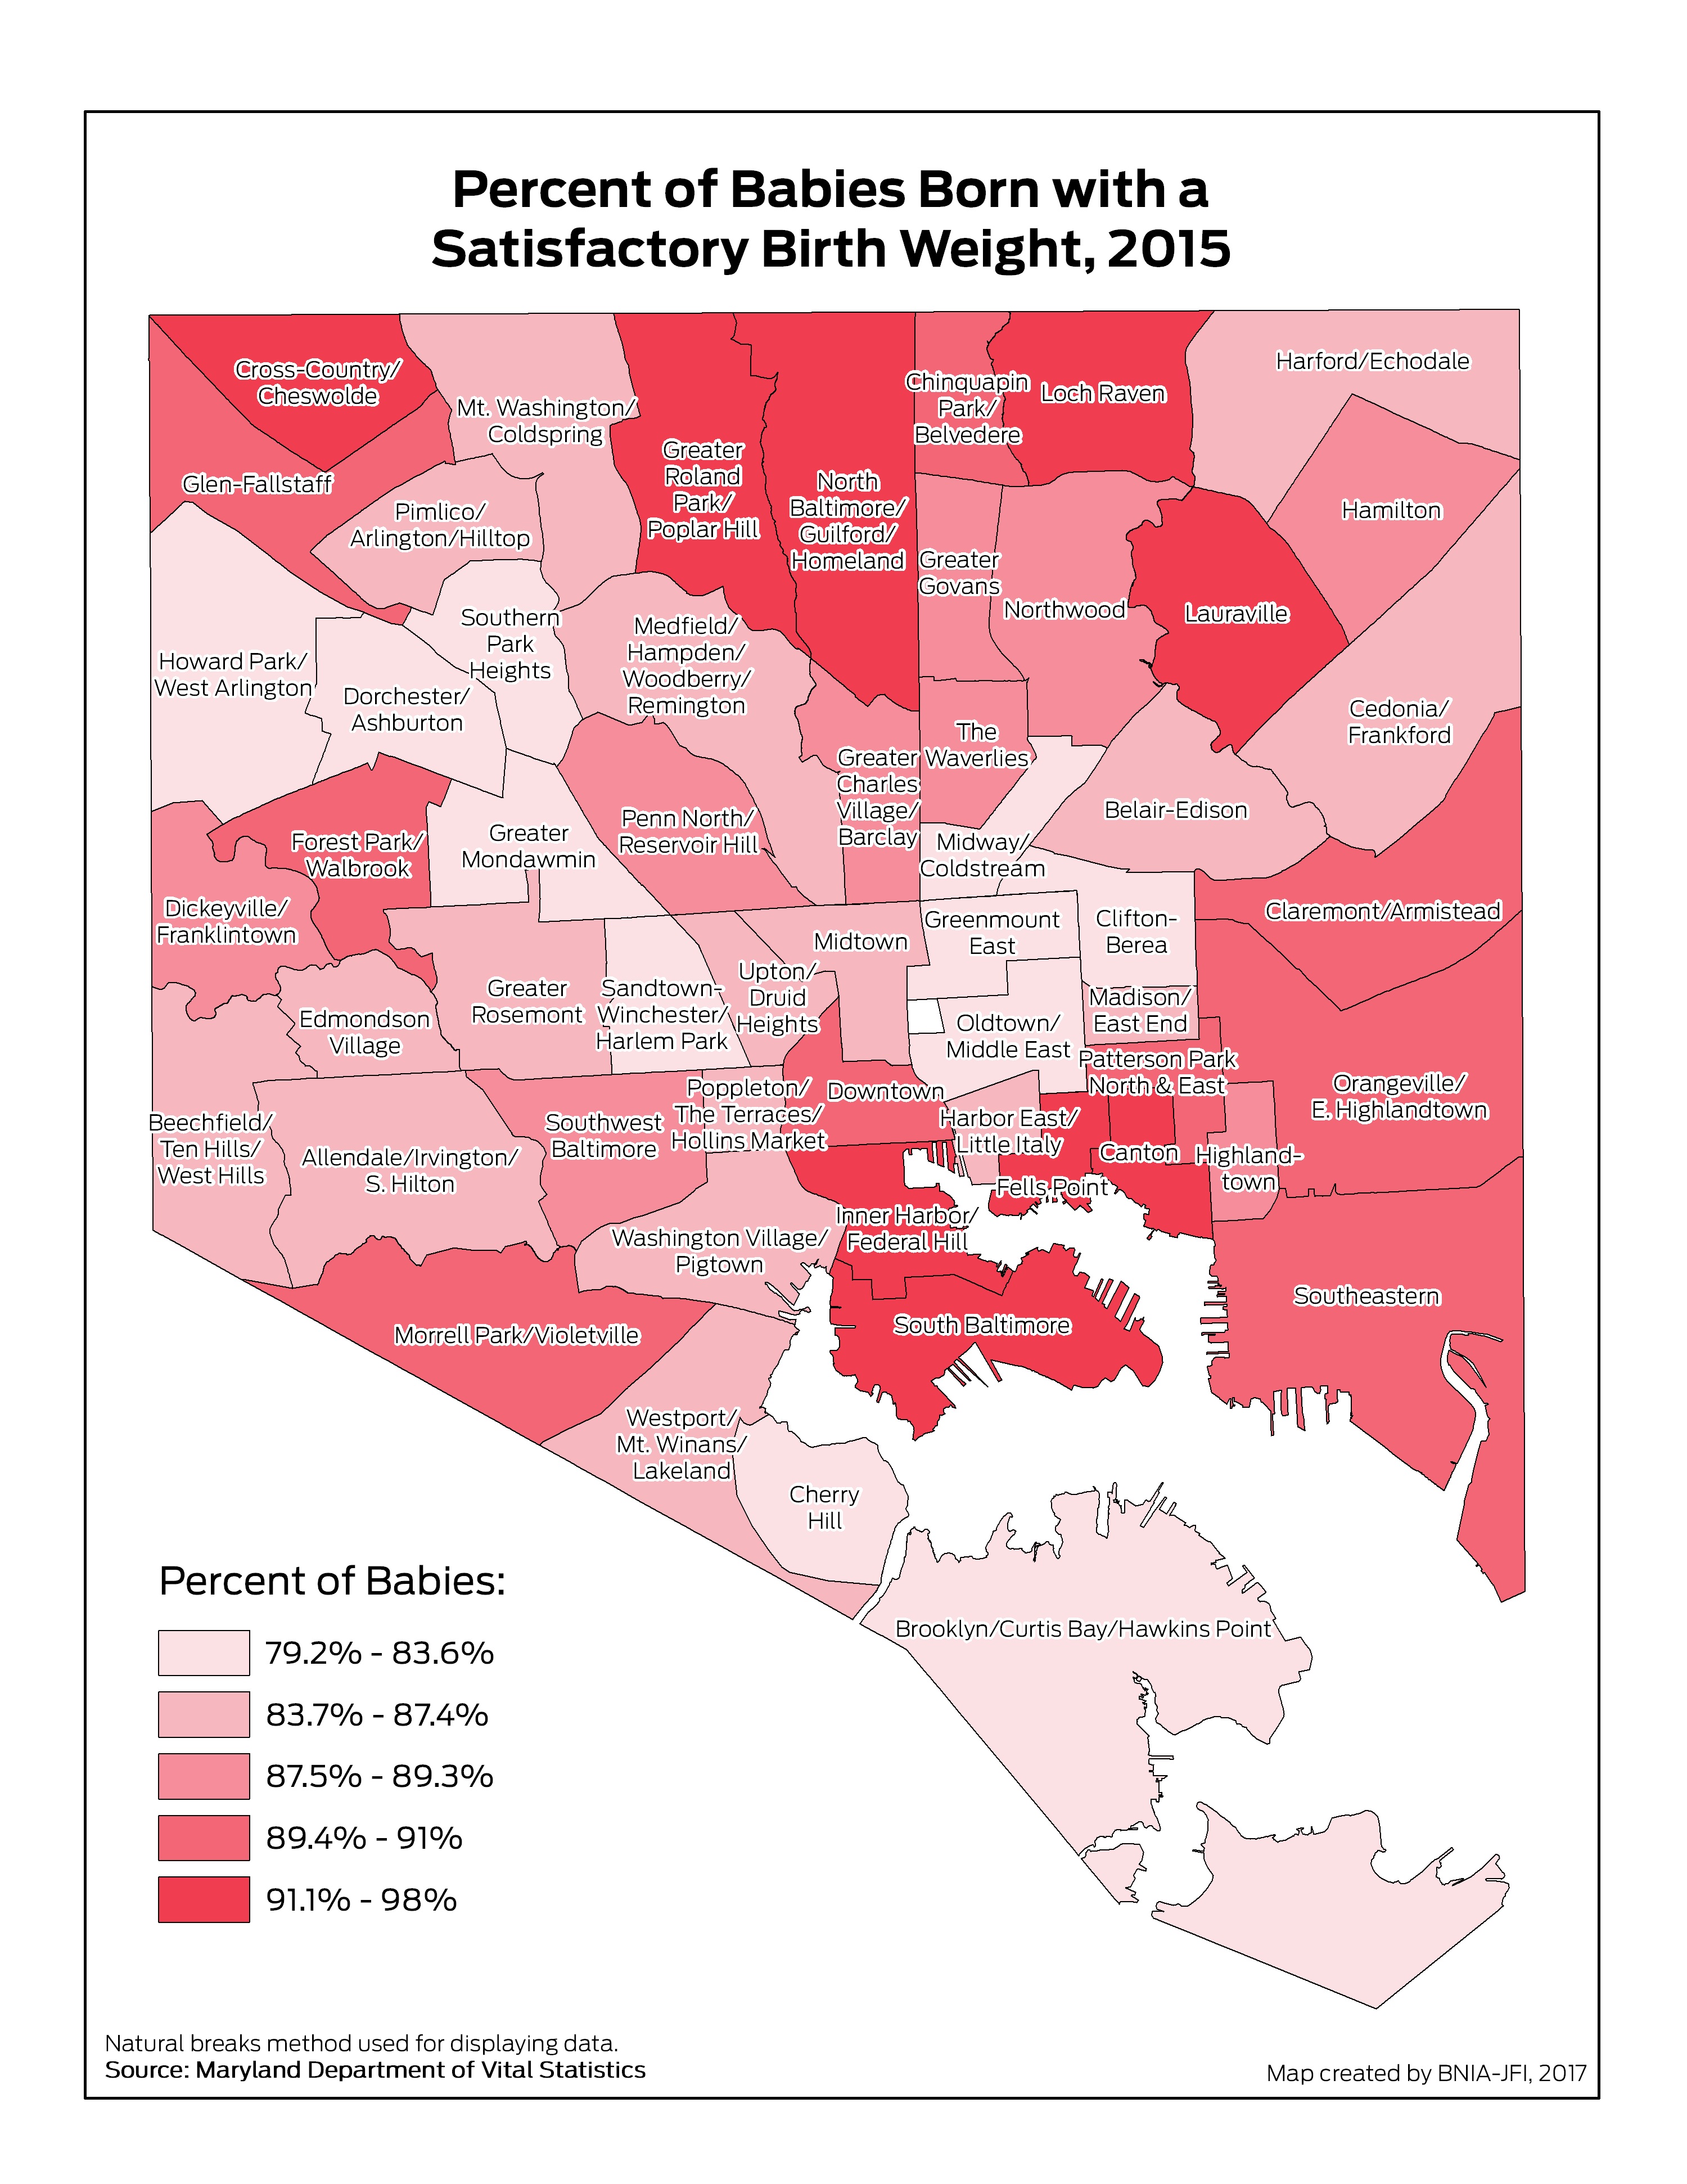
Percent of Babies Born with a Satisfactory Birth Weight
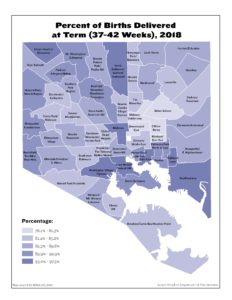
Percent of Babies Delivered at Term (37-42 Weeks)
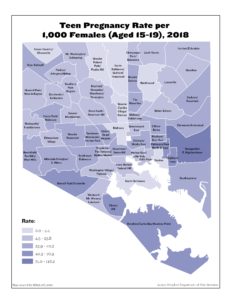
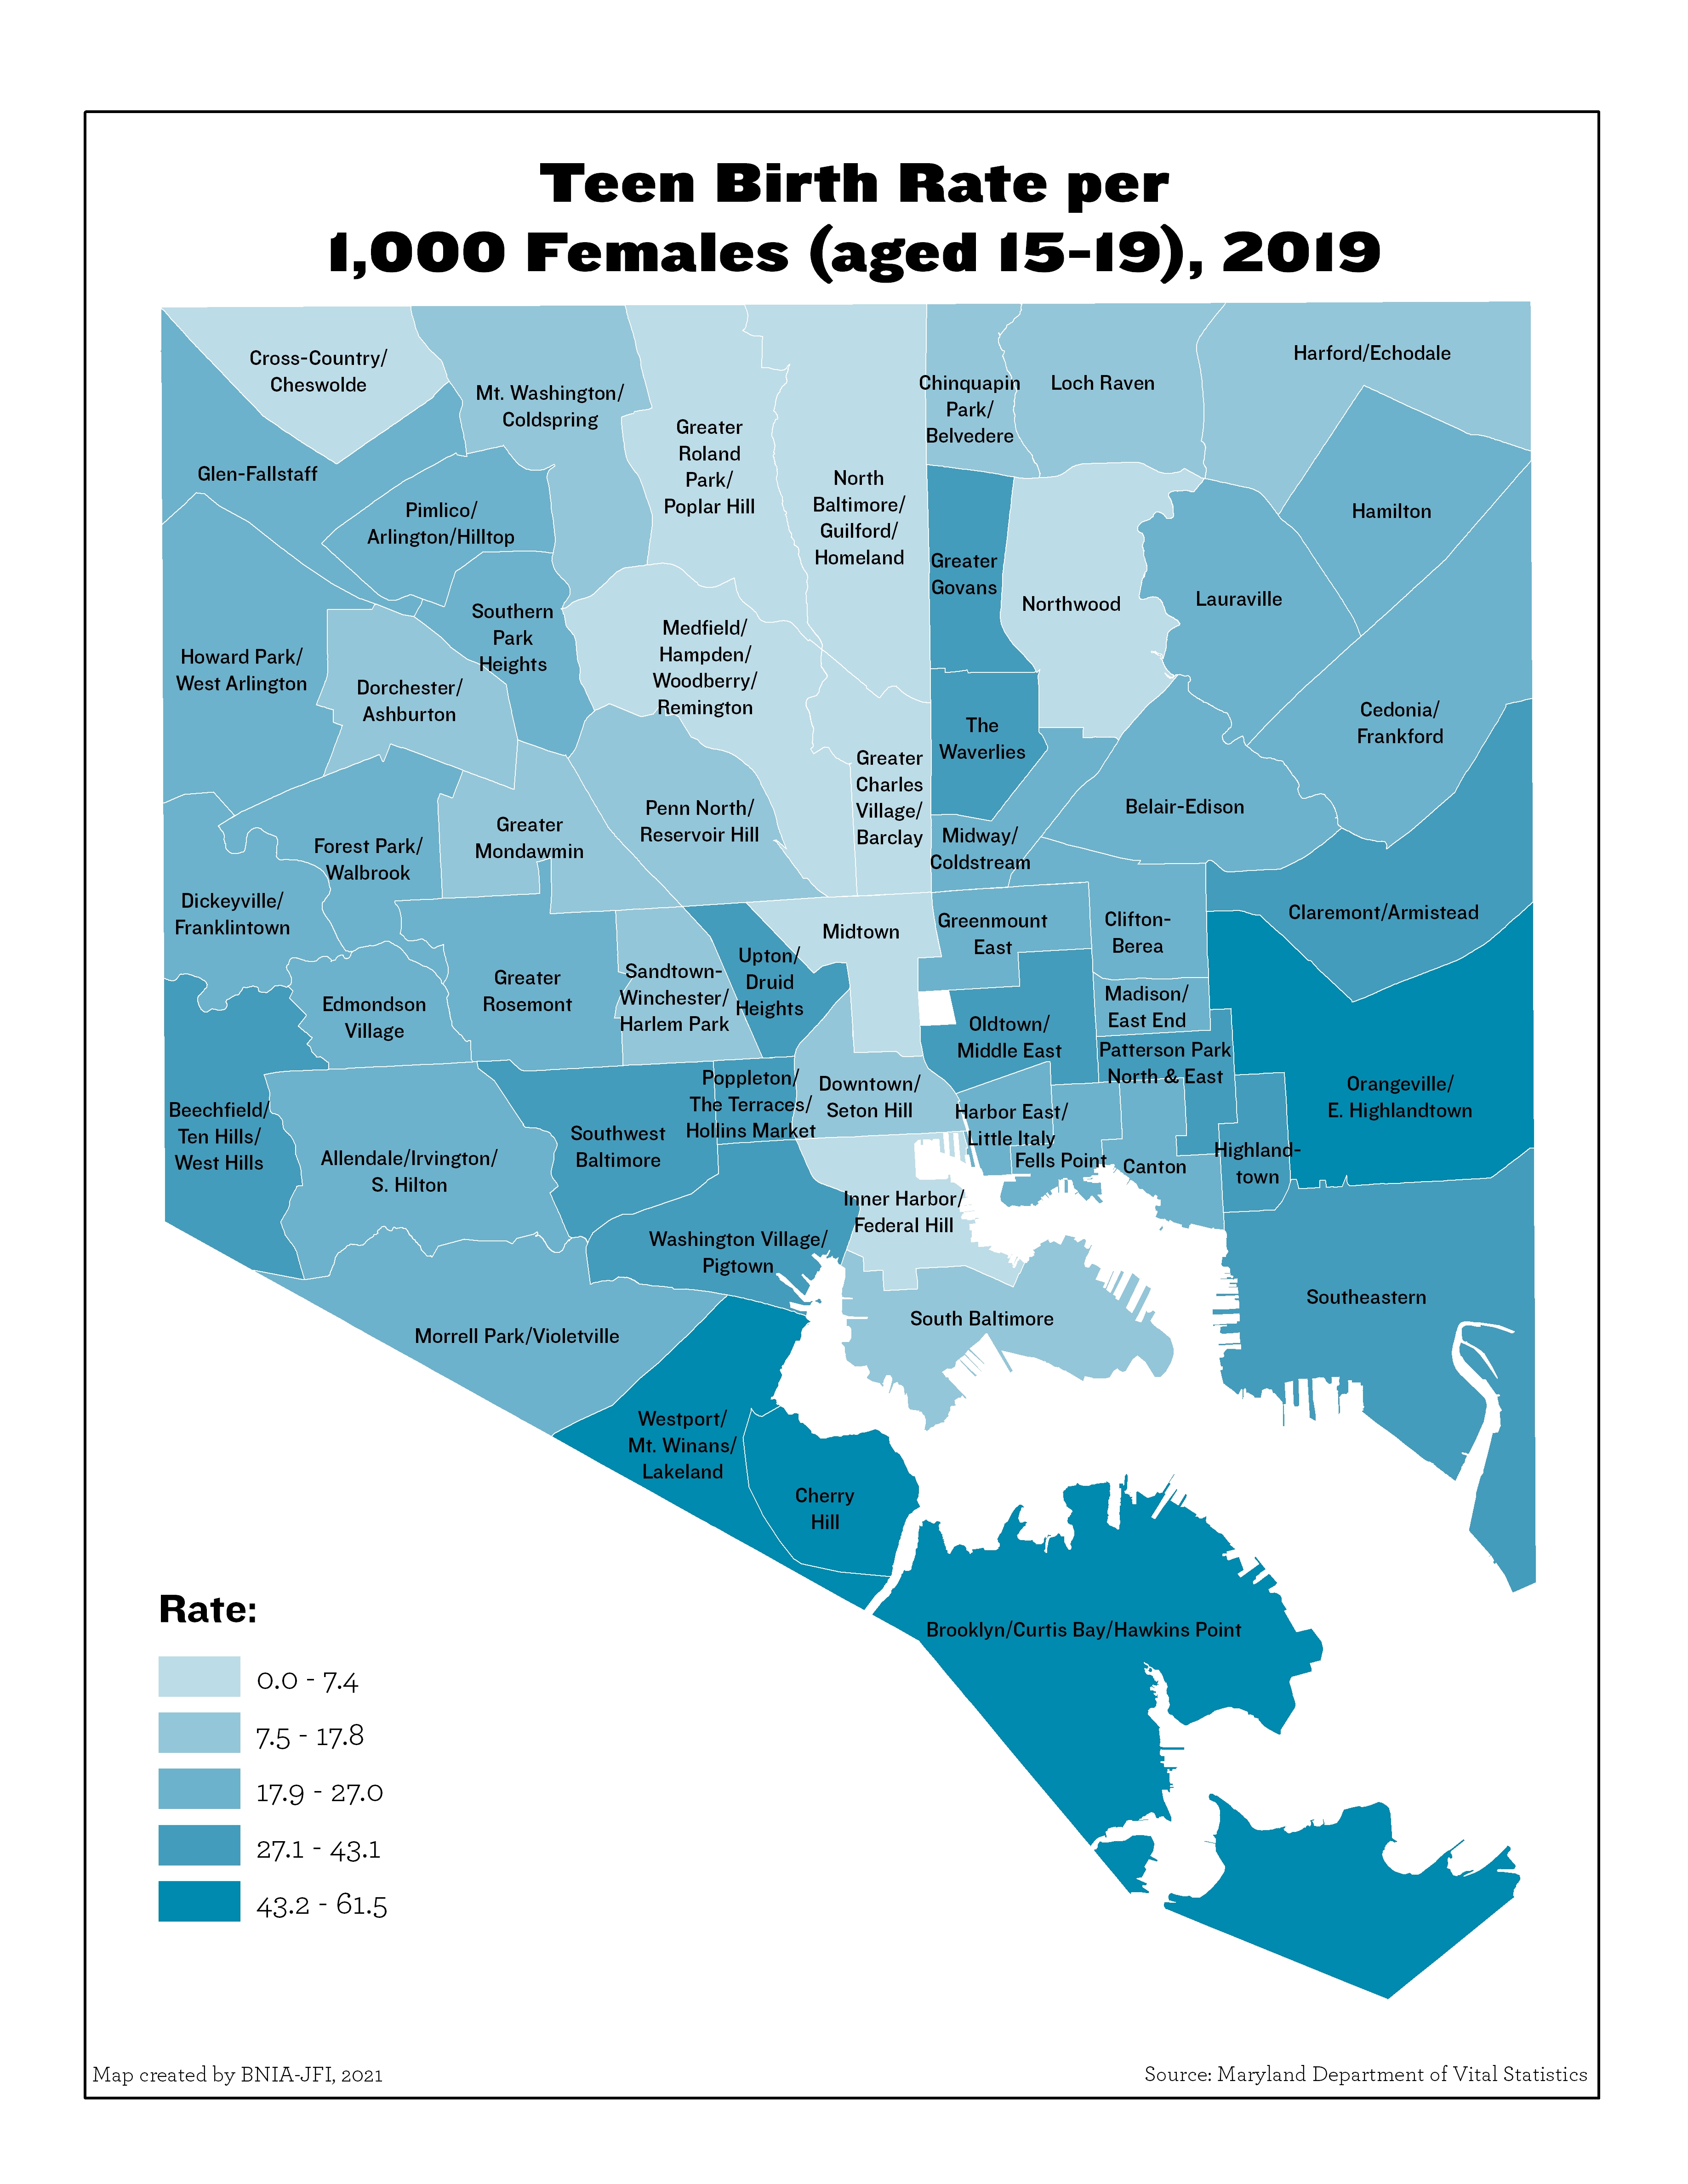
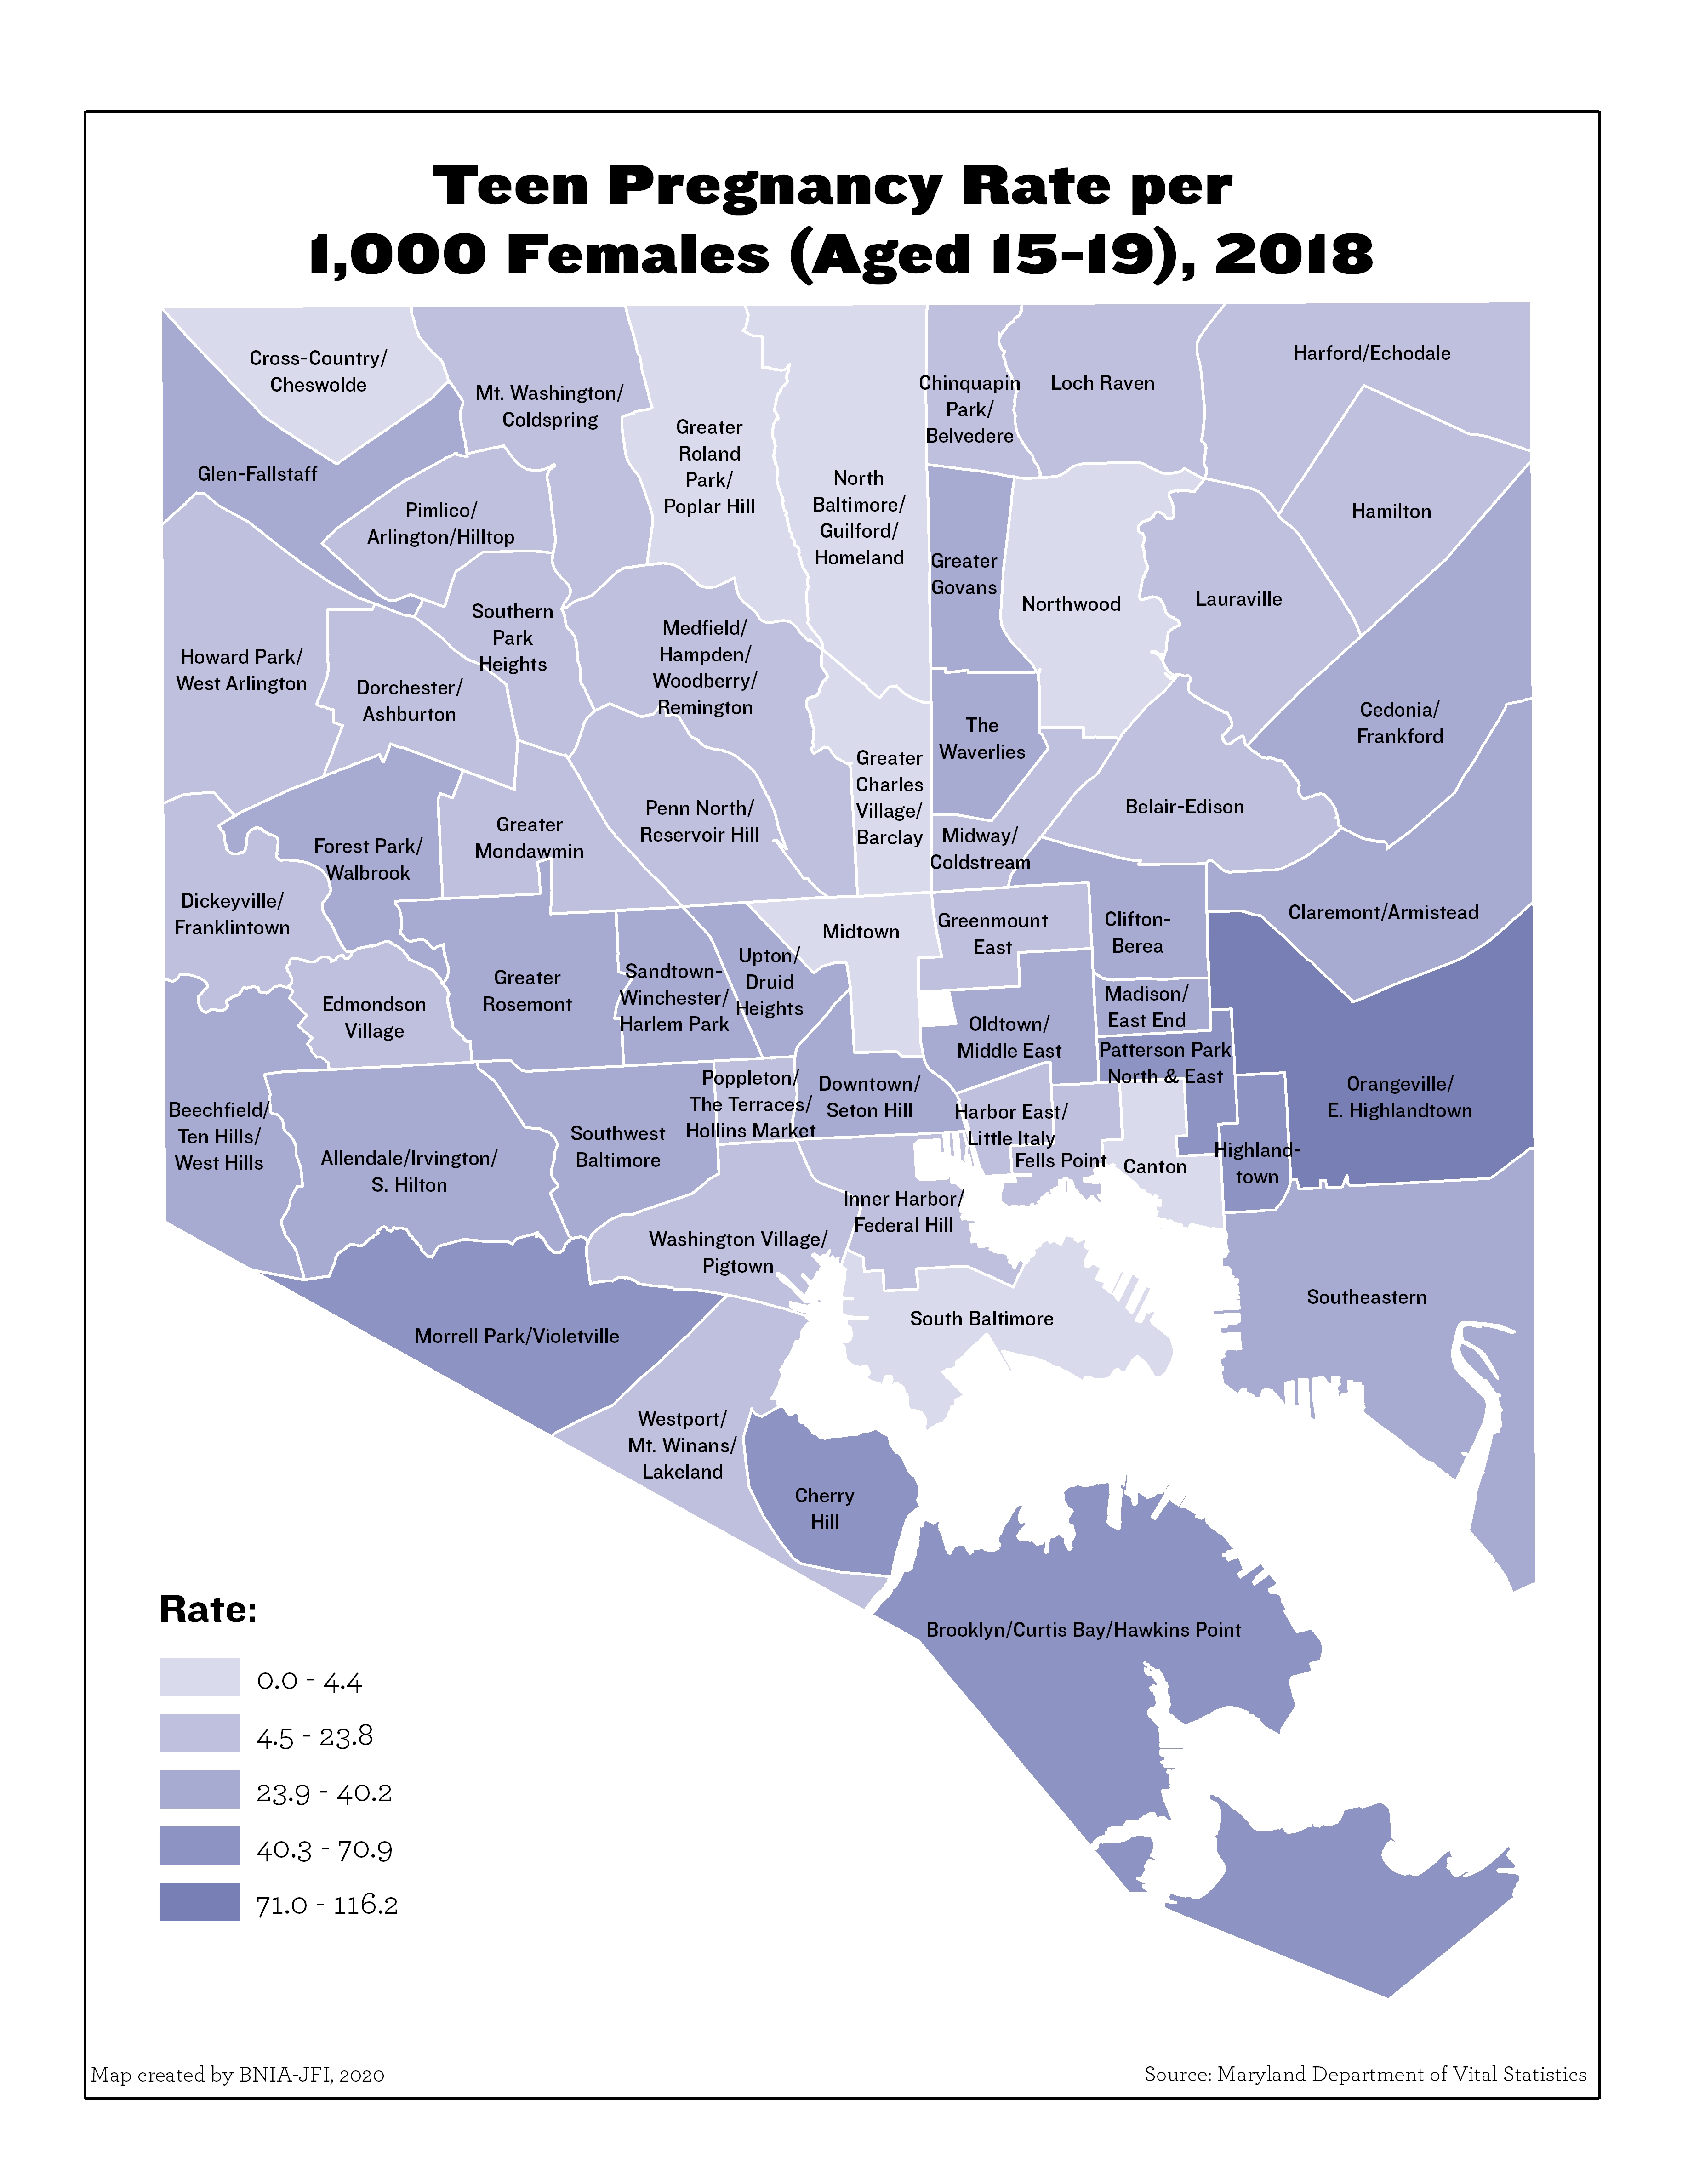
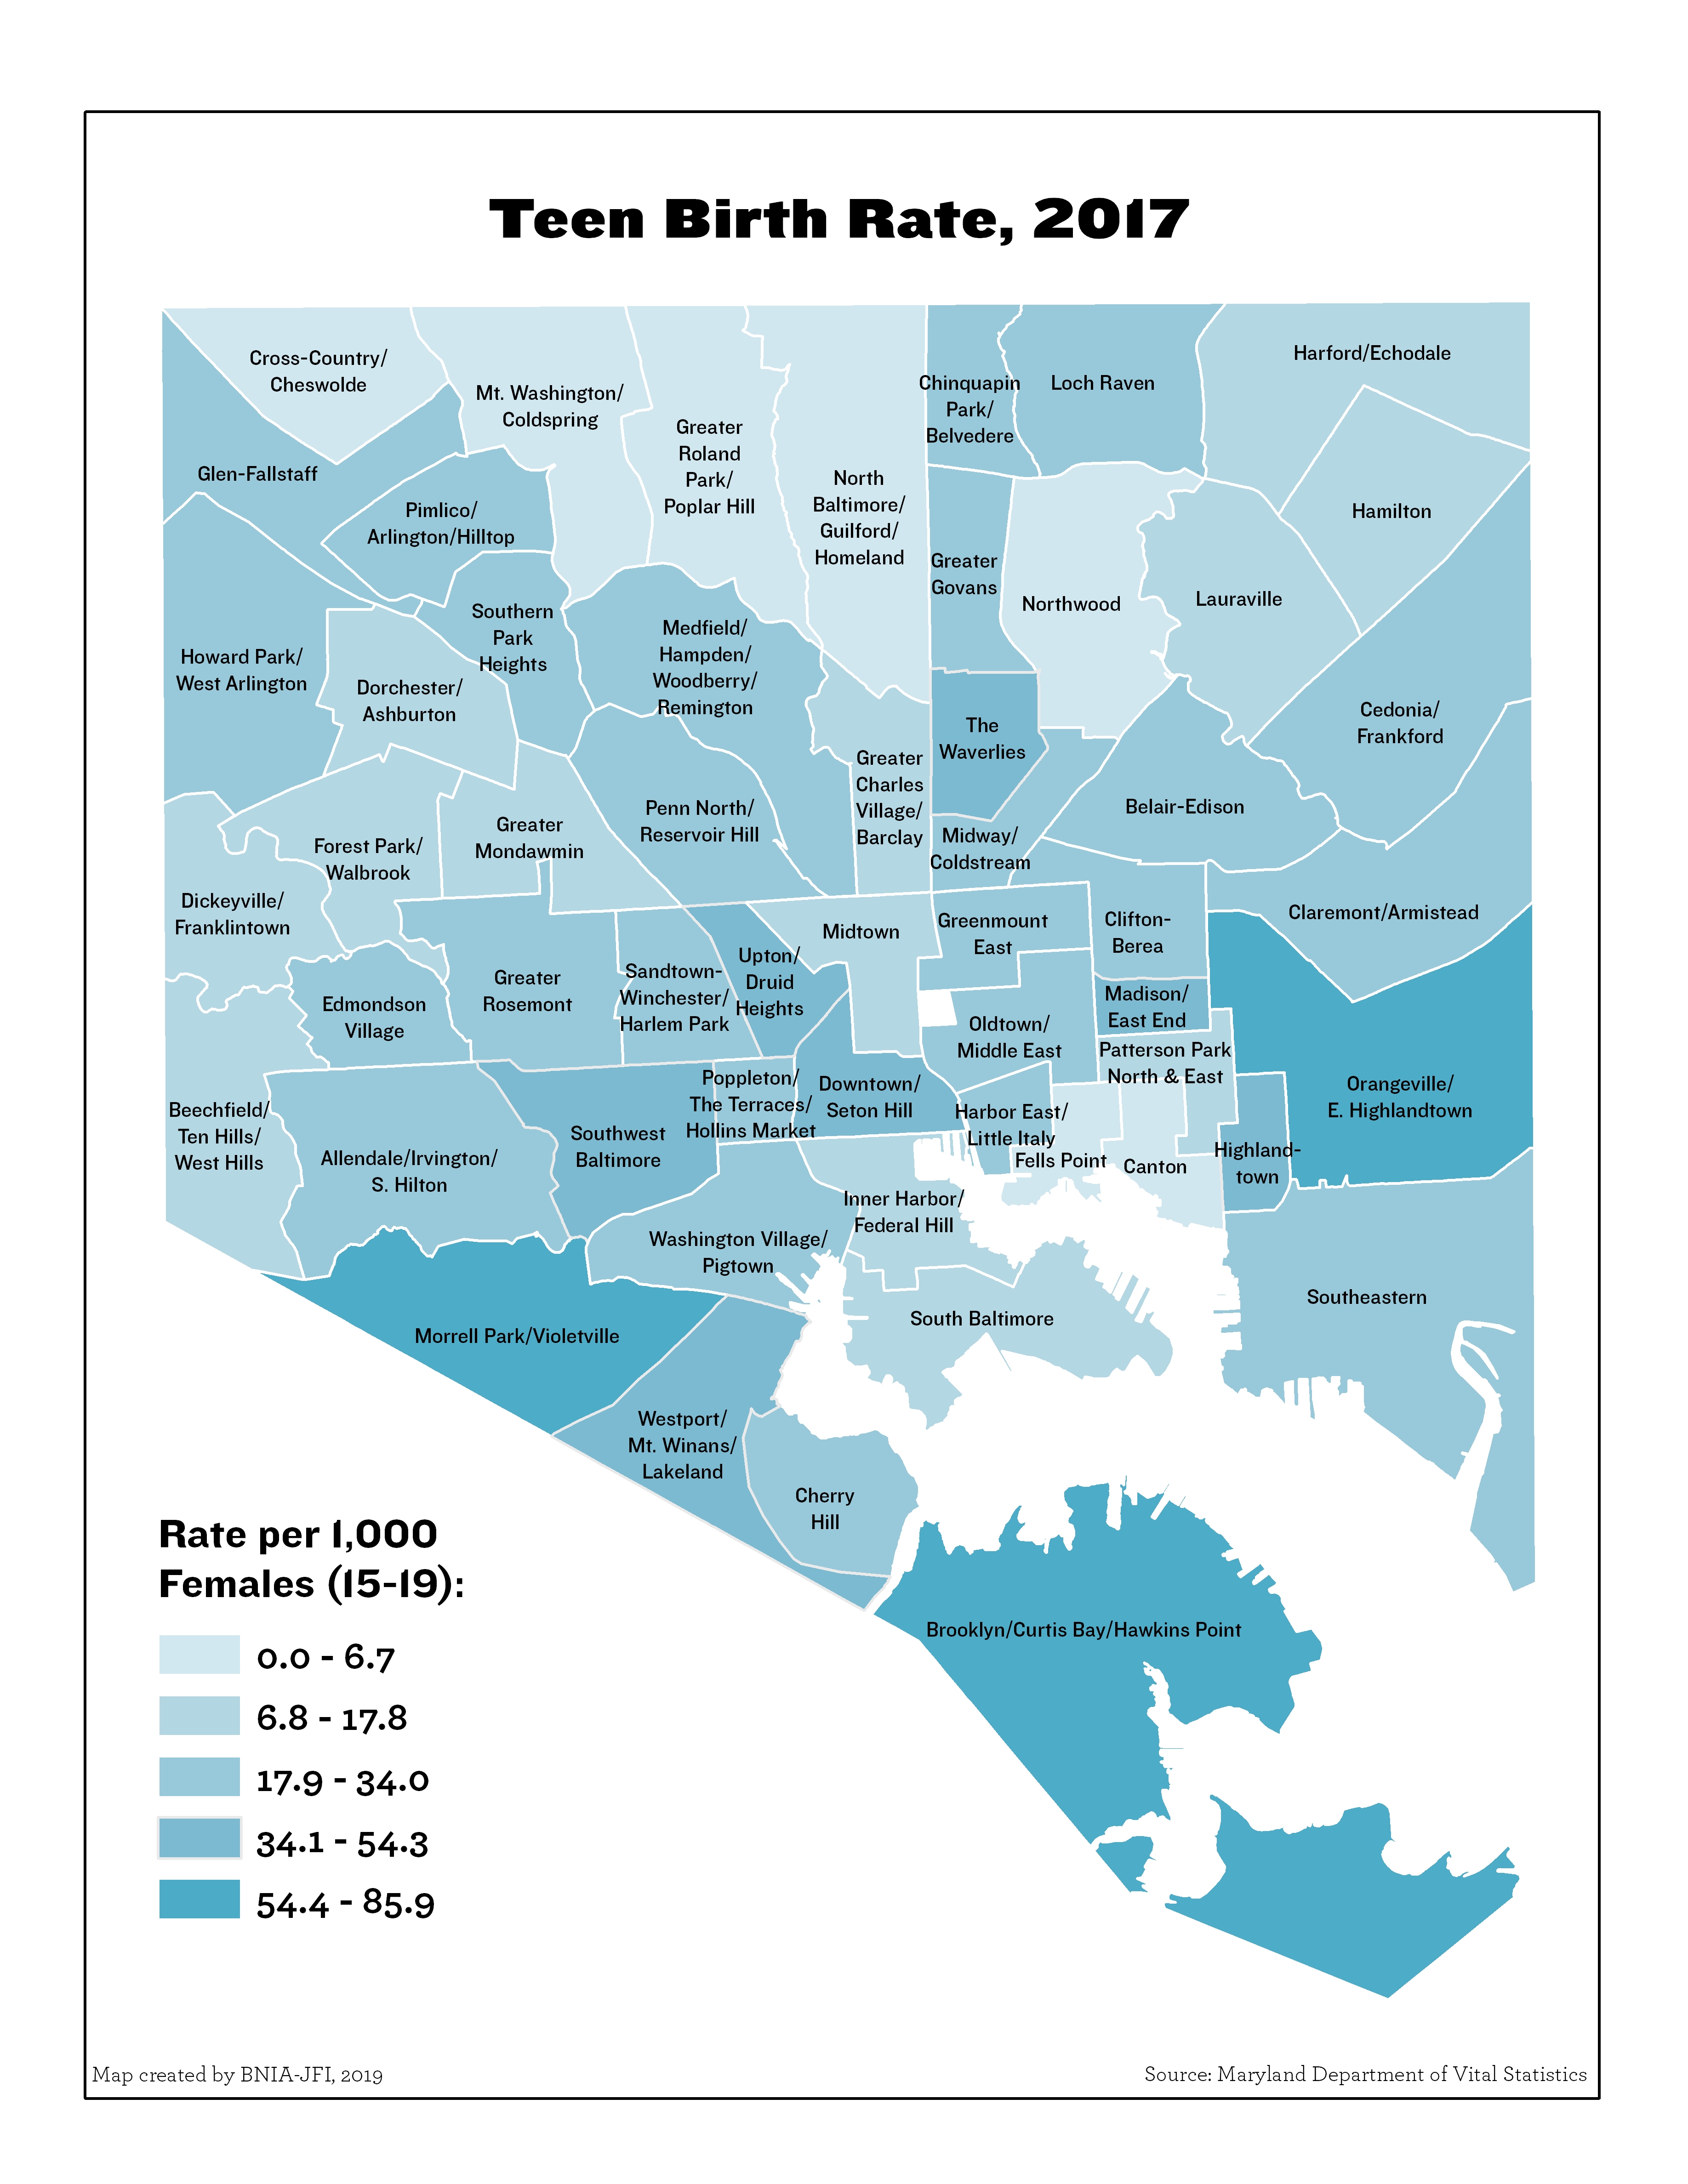
Teen Pregnancy Rate per 1,000 Females (Aged 15-19)
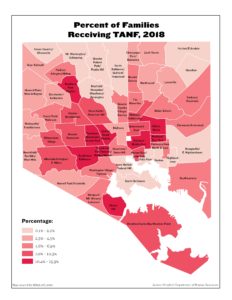
Percent of Families Receiving TANF
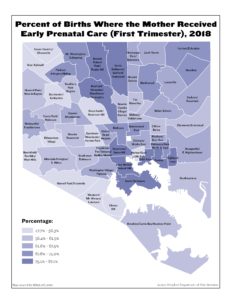
Percent of Births Where the Mother Received Early Prenatal Care (First Trimester)
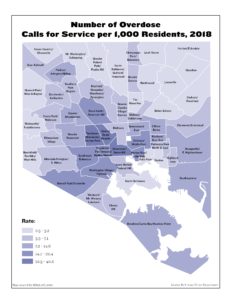
Number of Overdose Calls for Service per 1,000 Residents
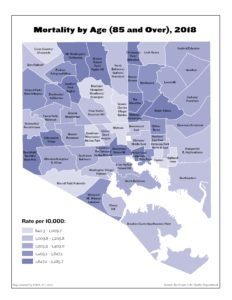
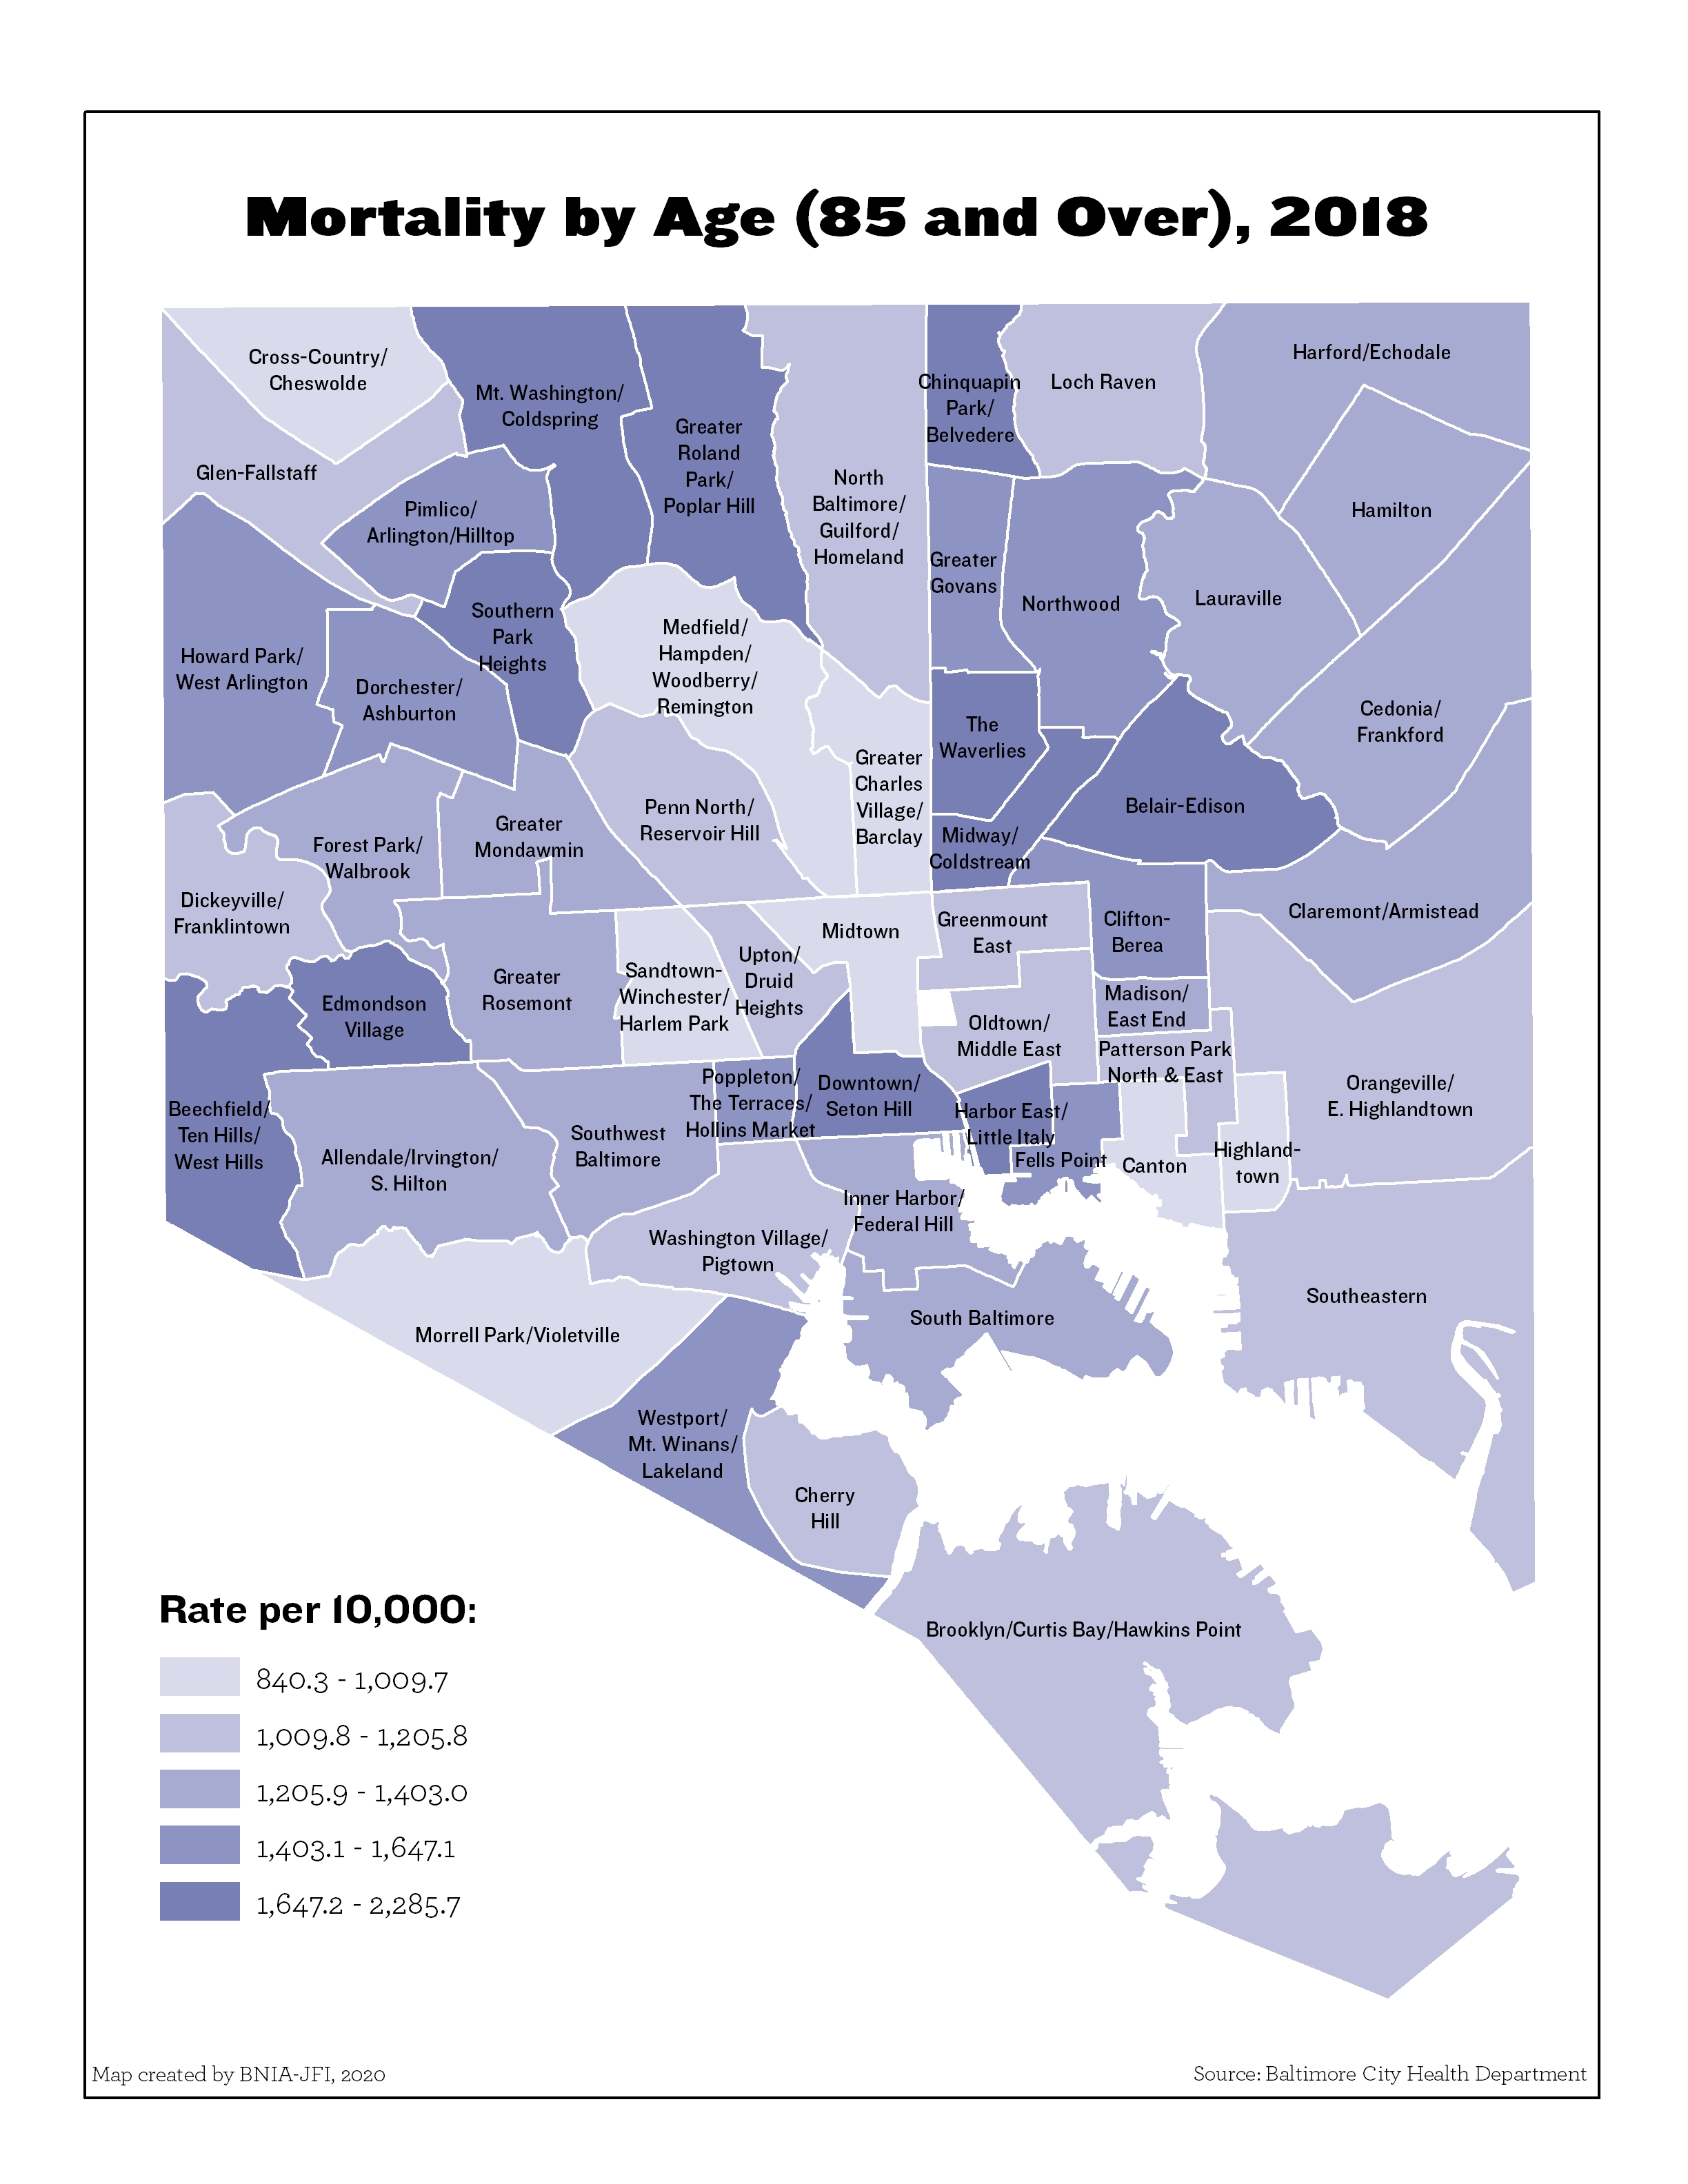
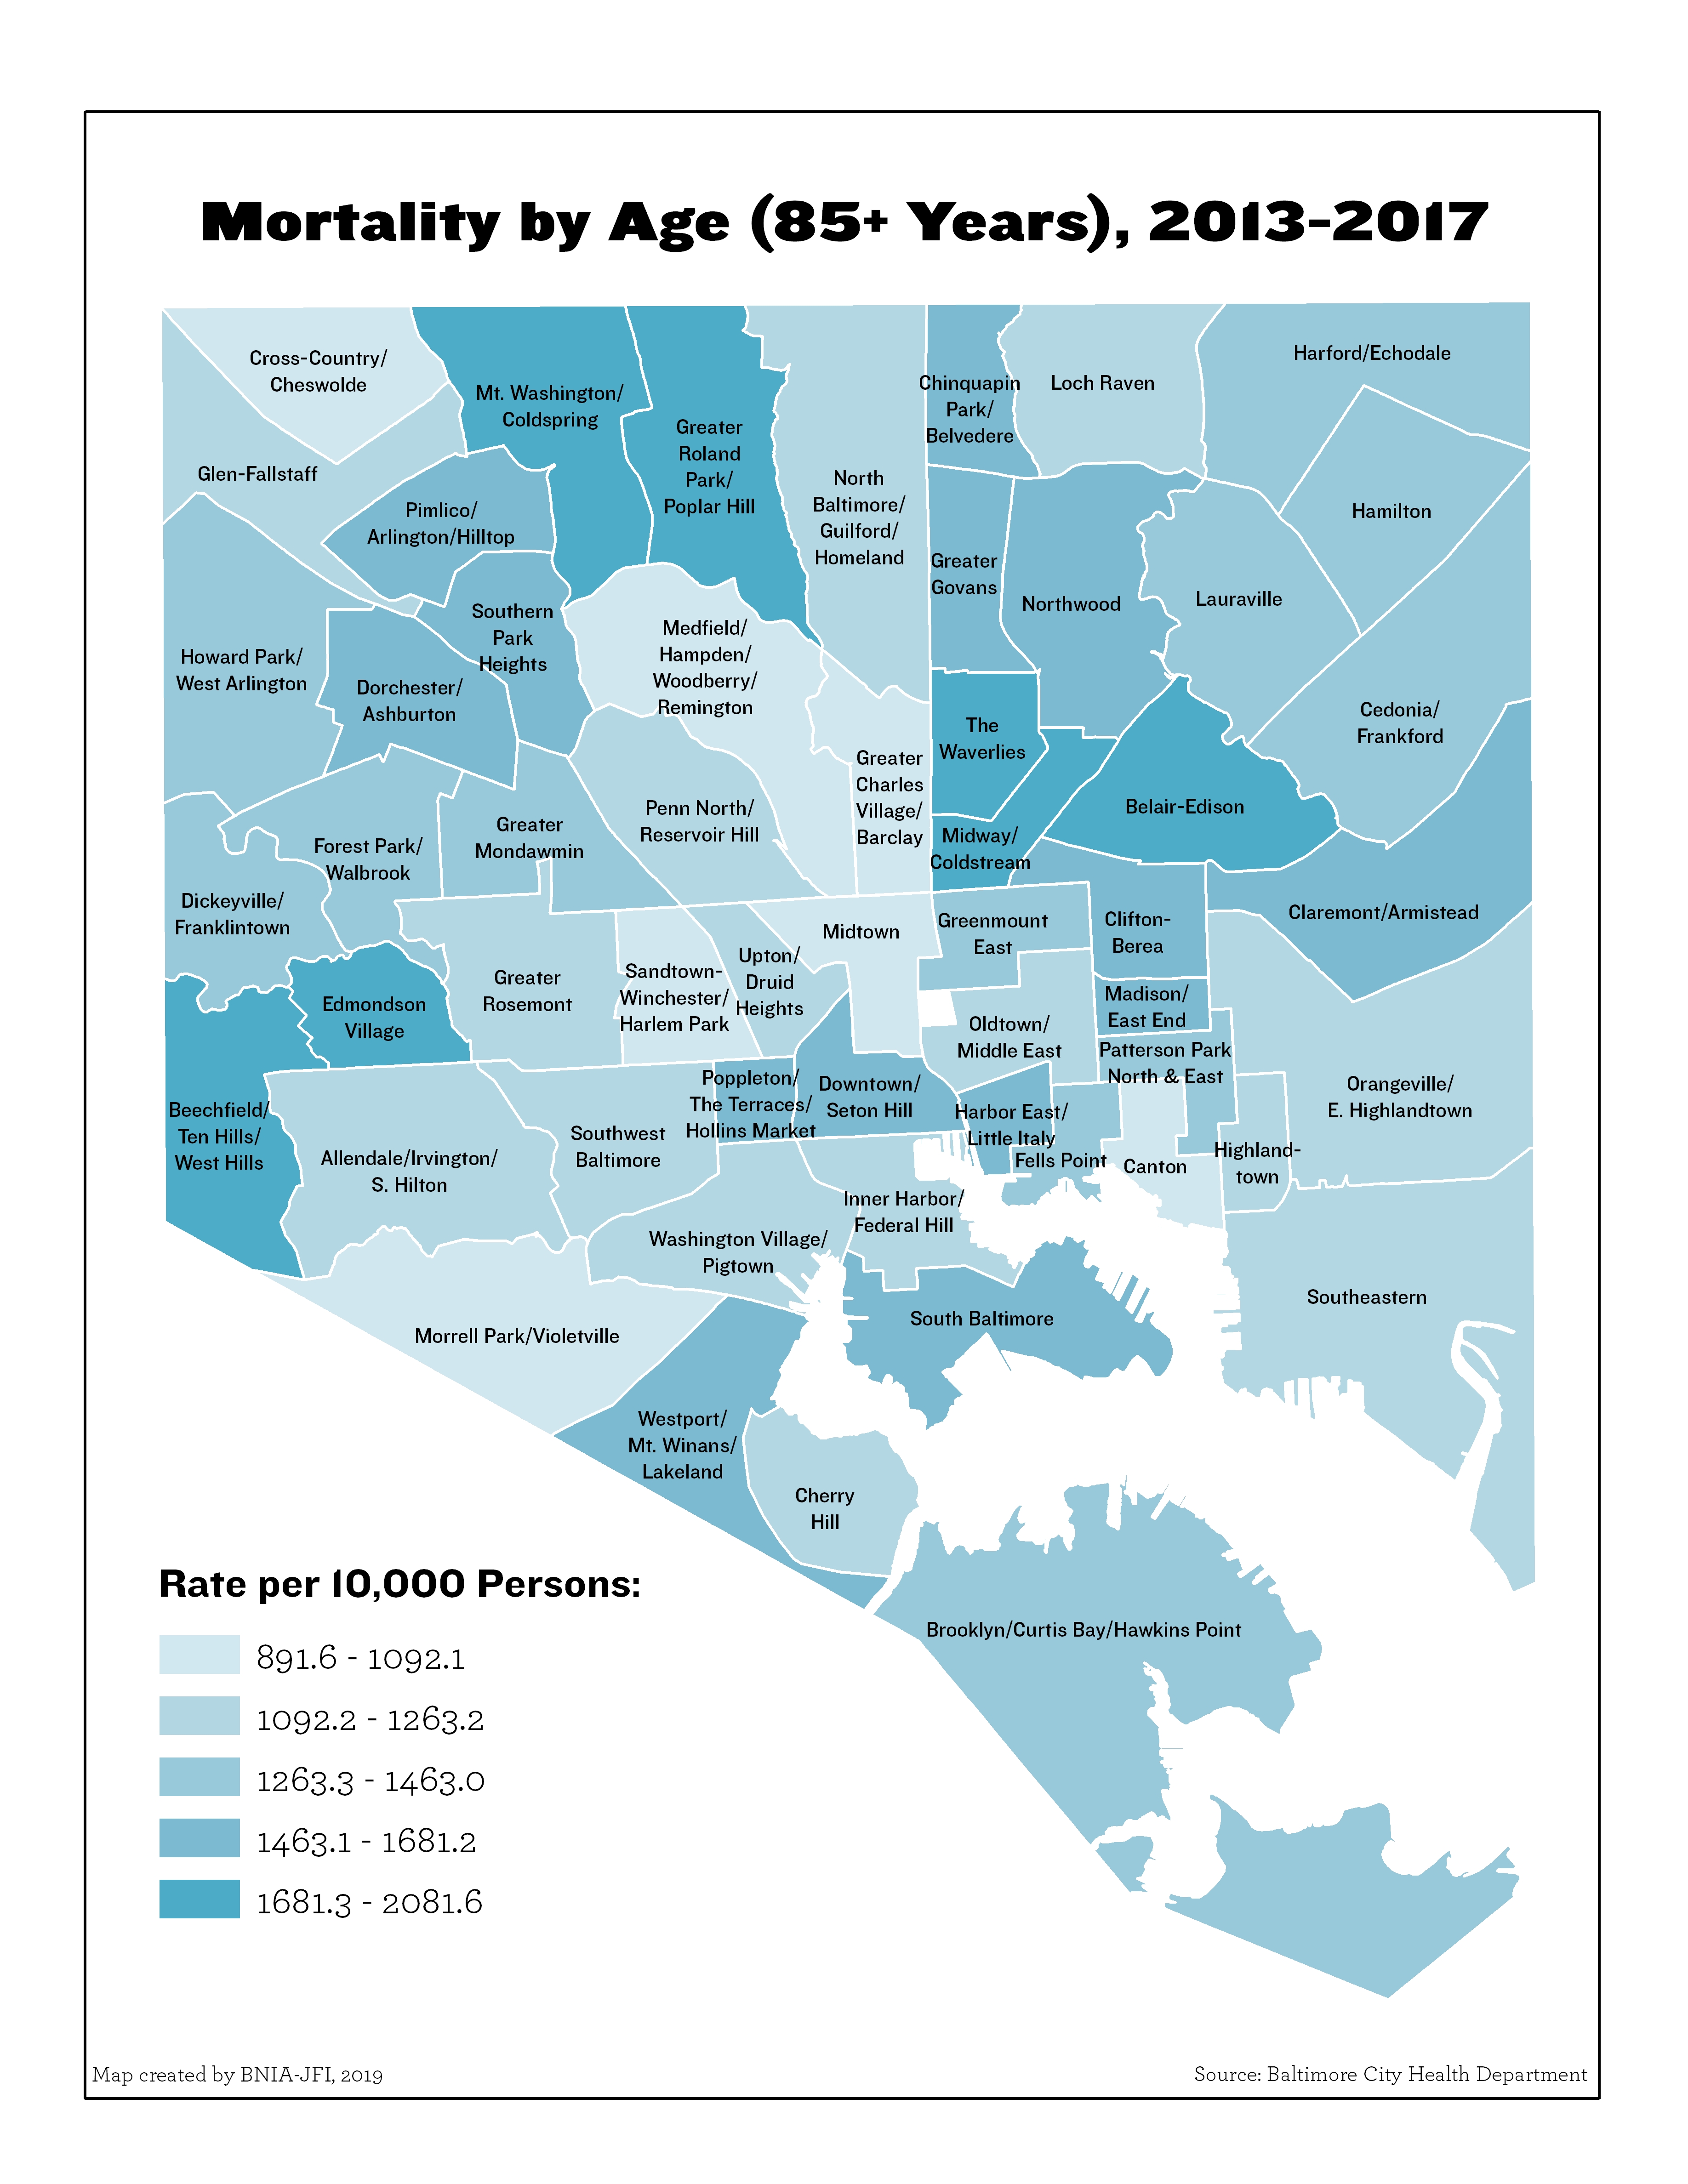
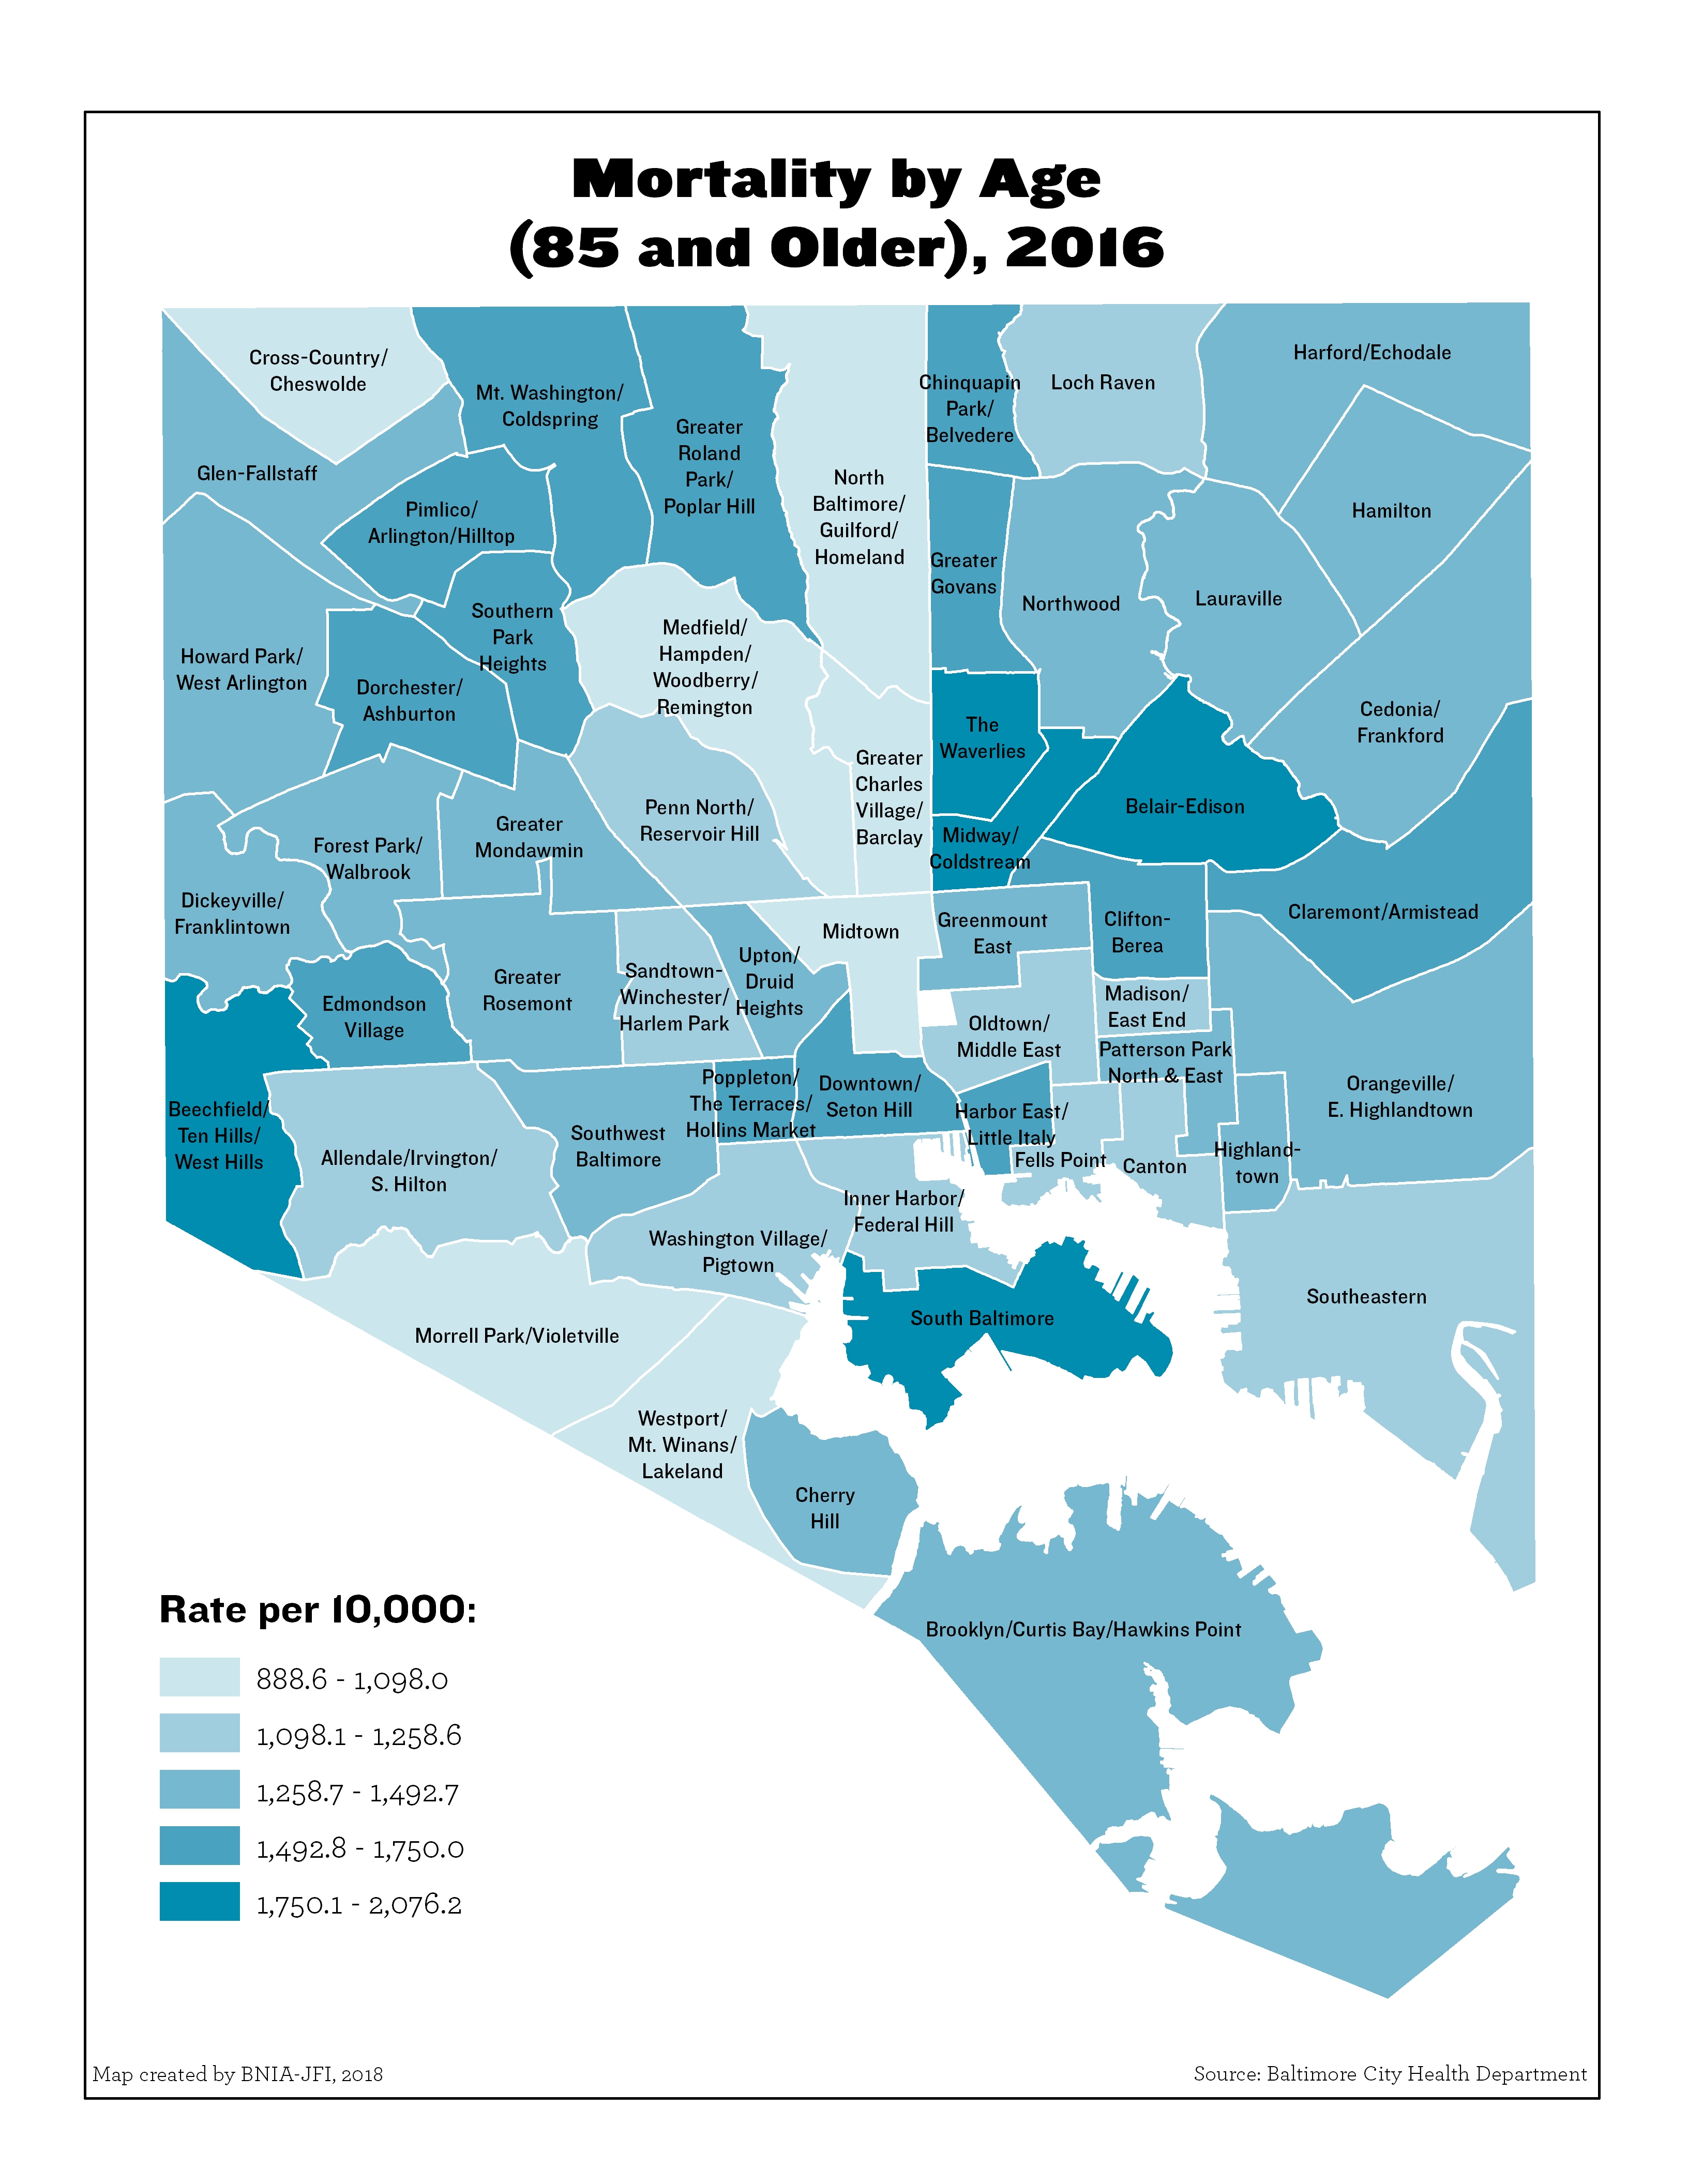
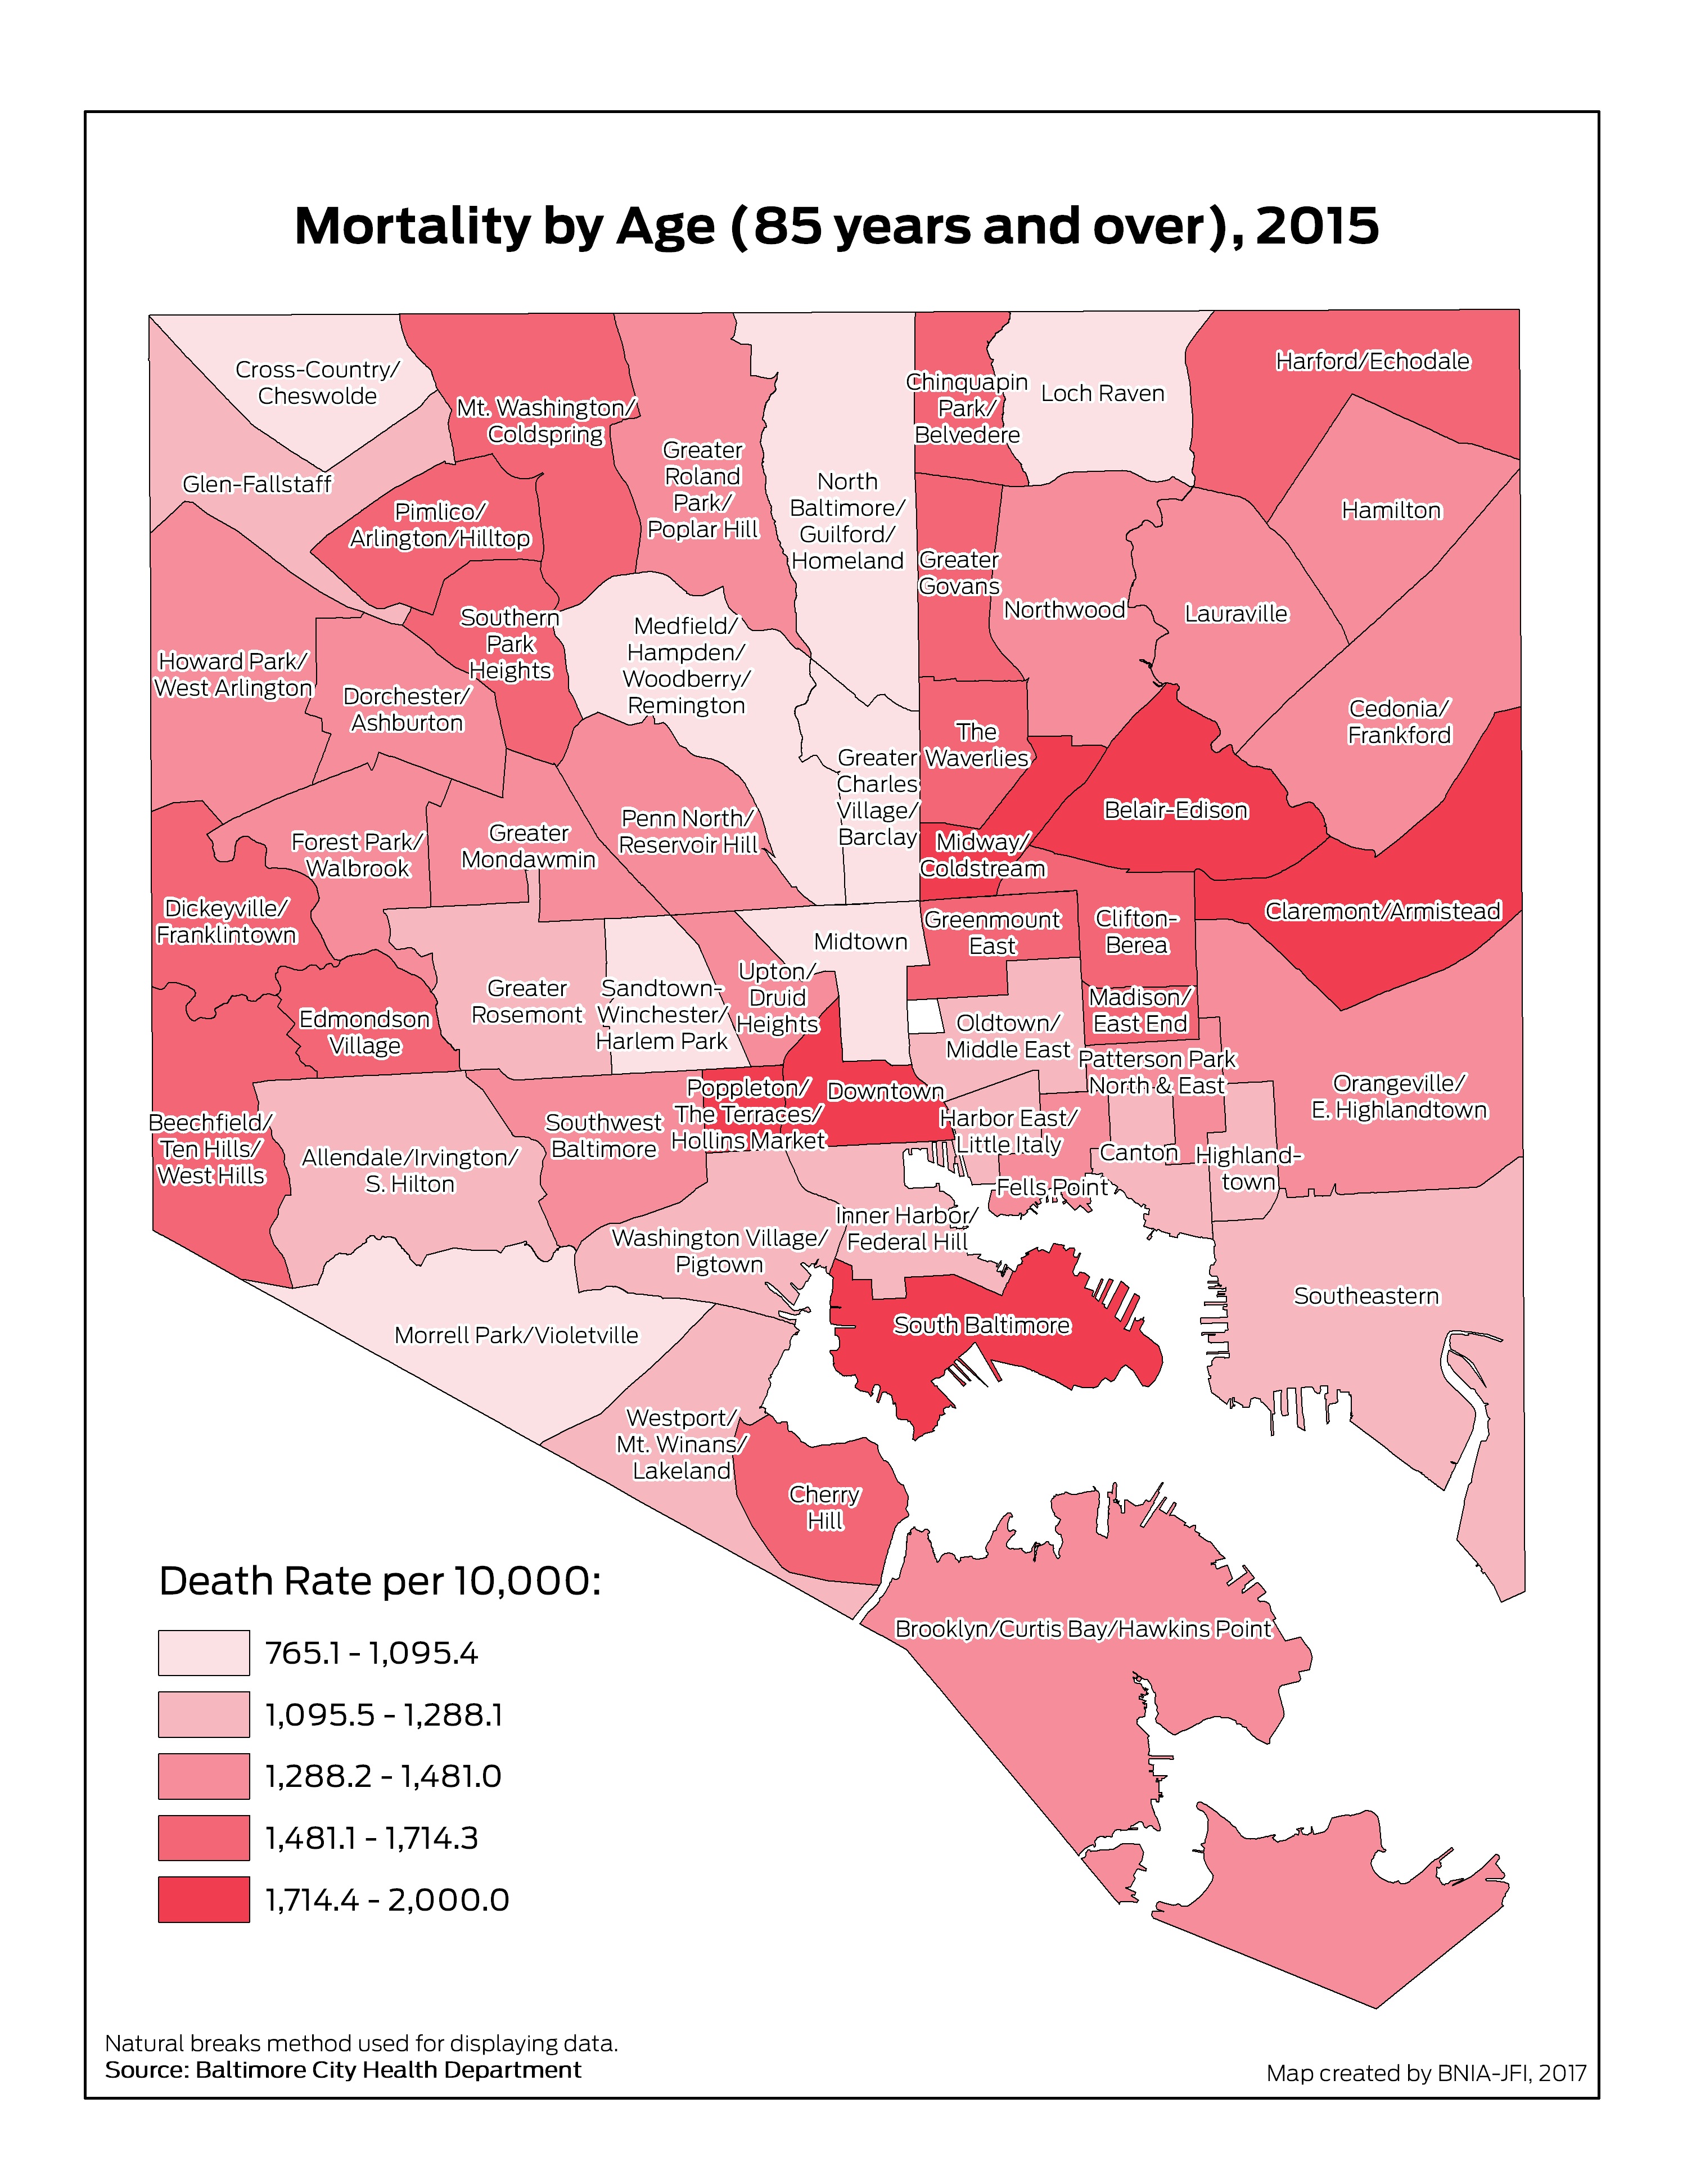
Mortality by Age (85 and Over)
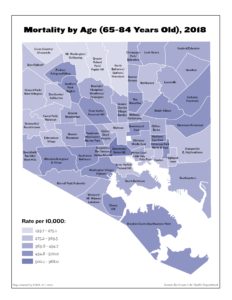
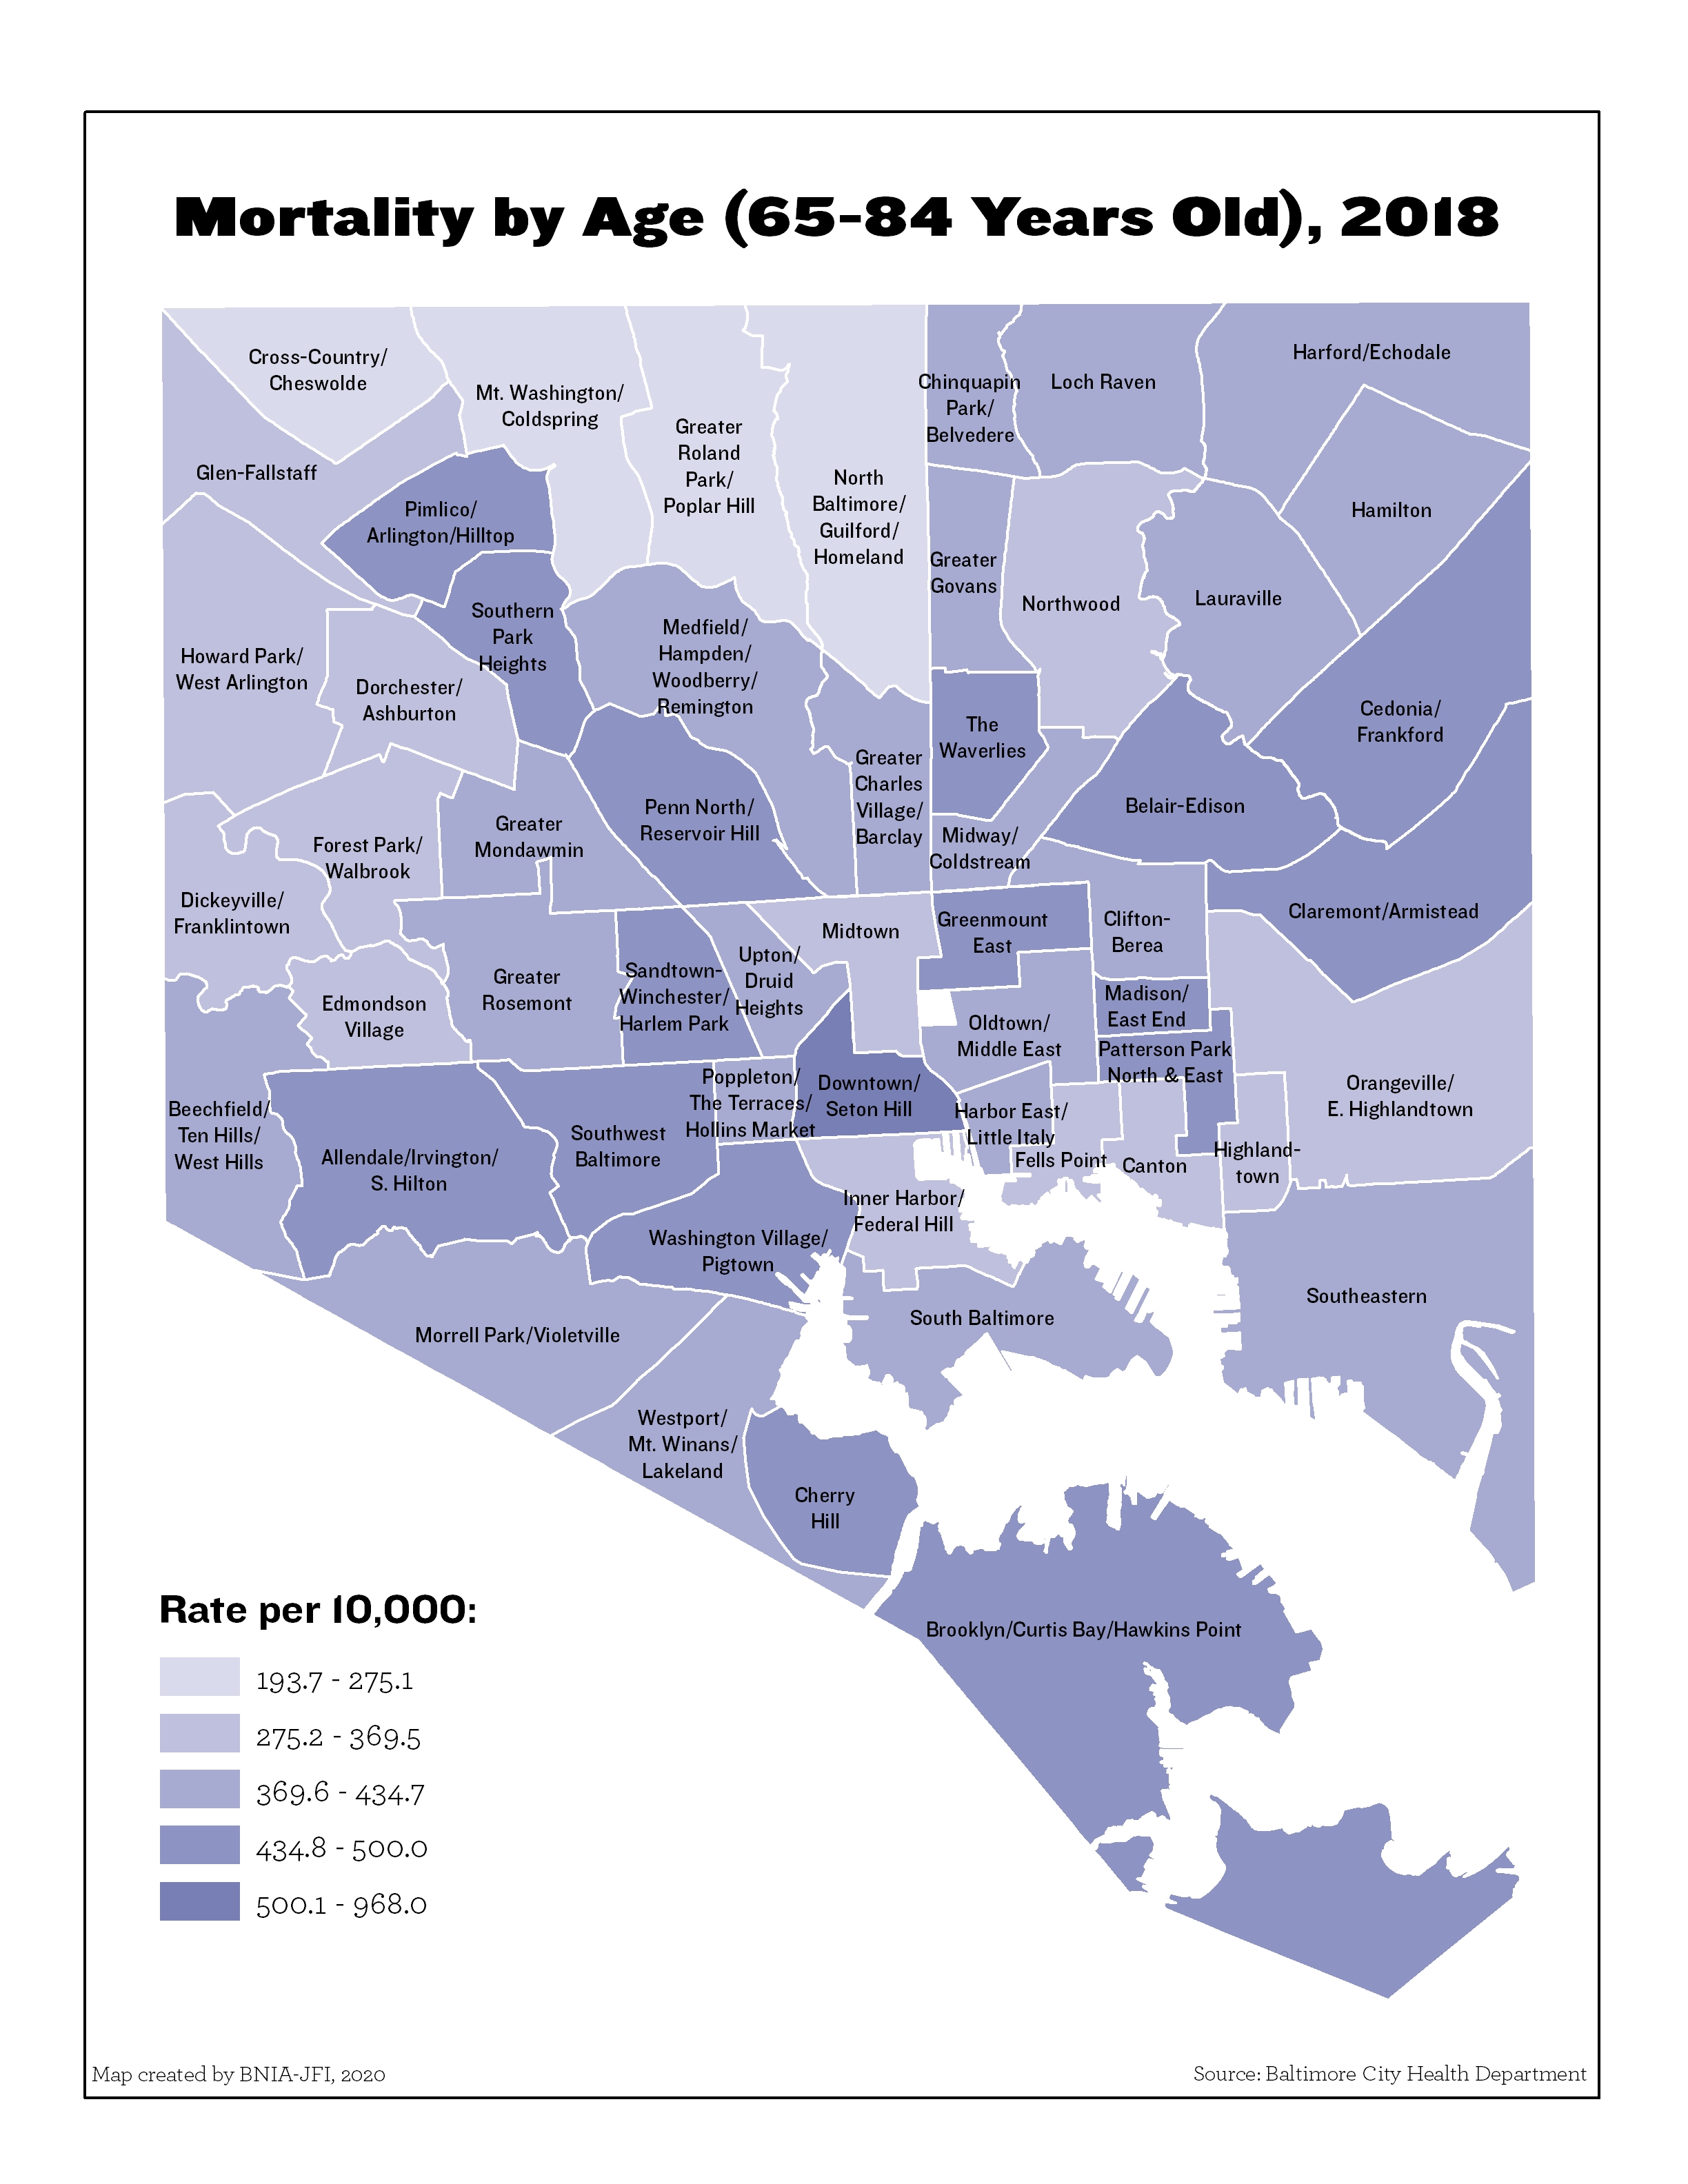
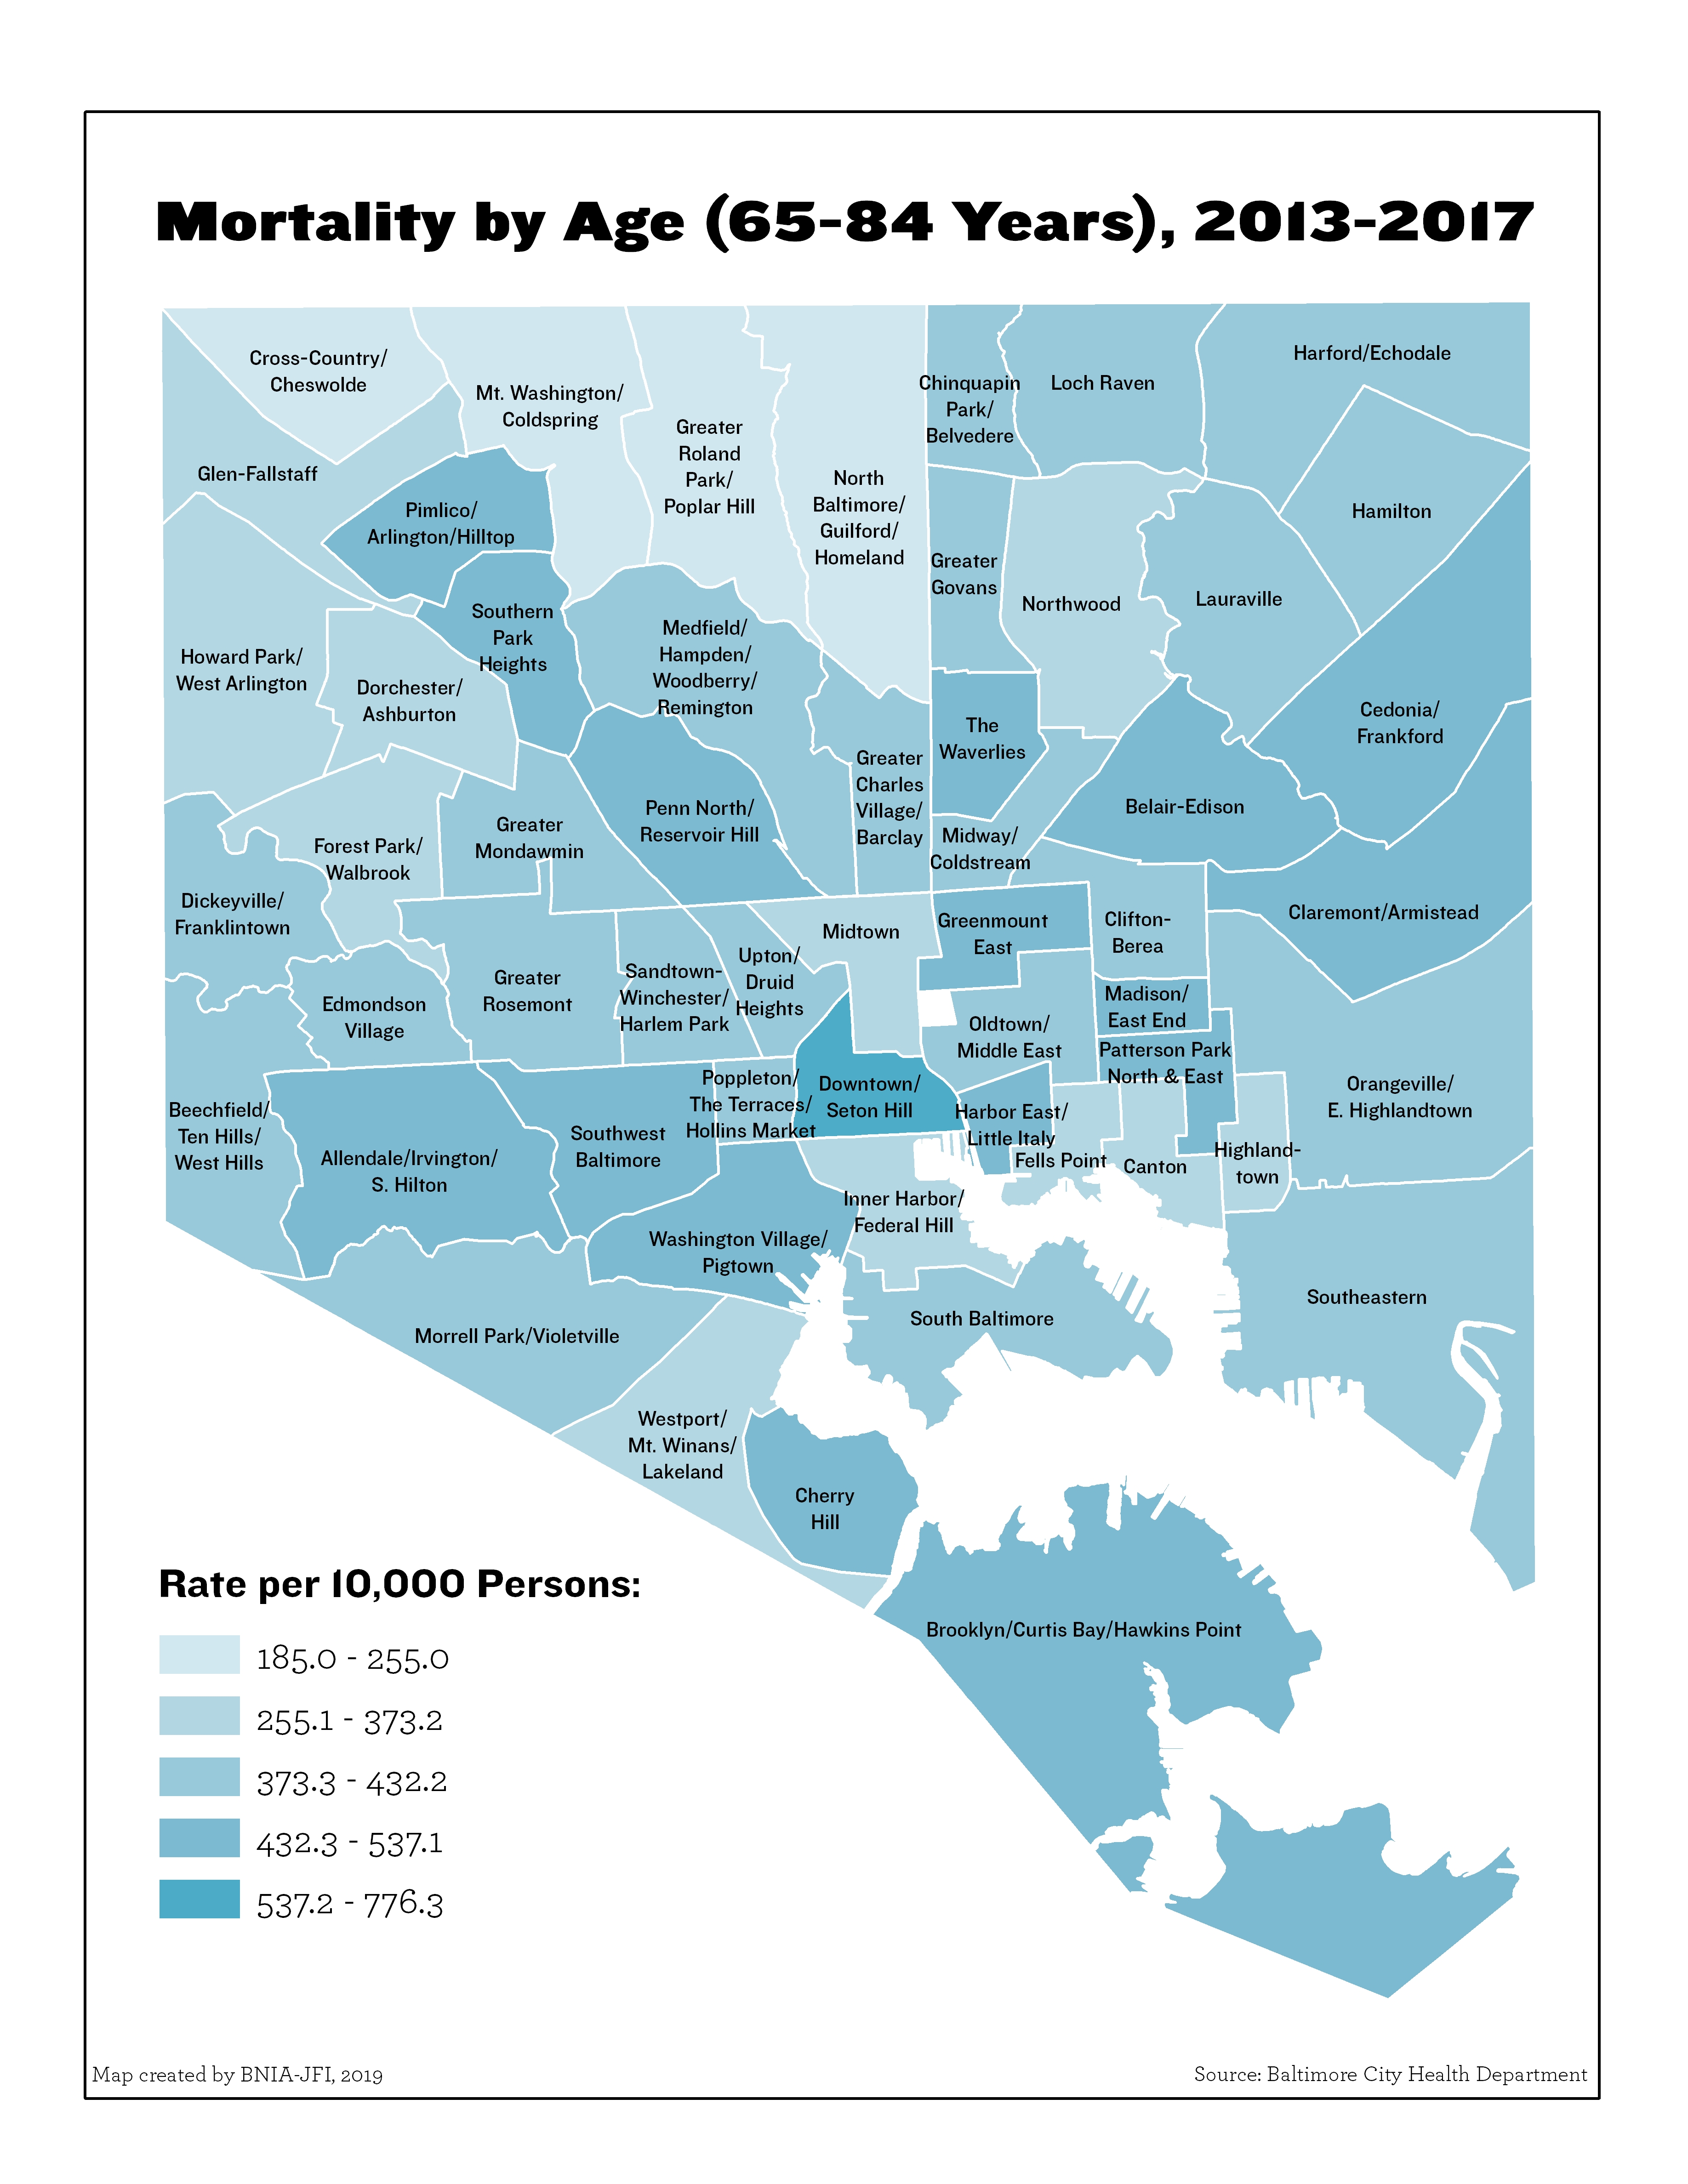
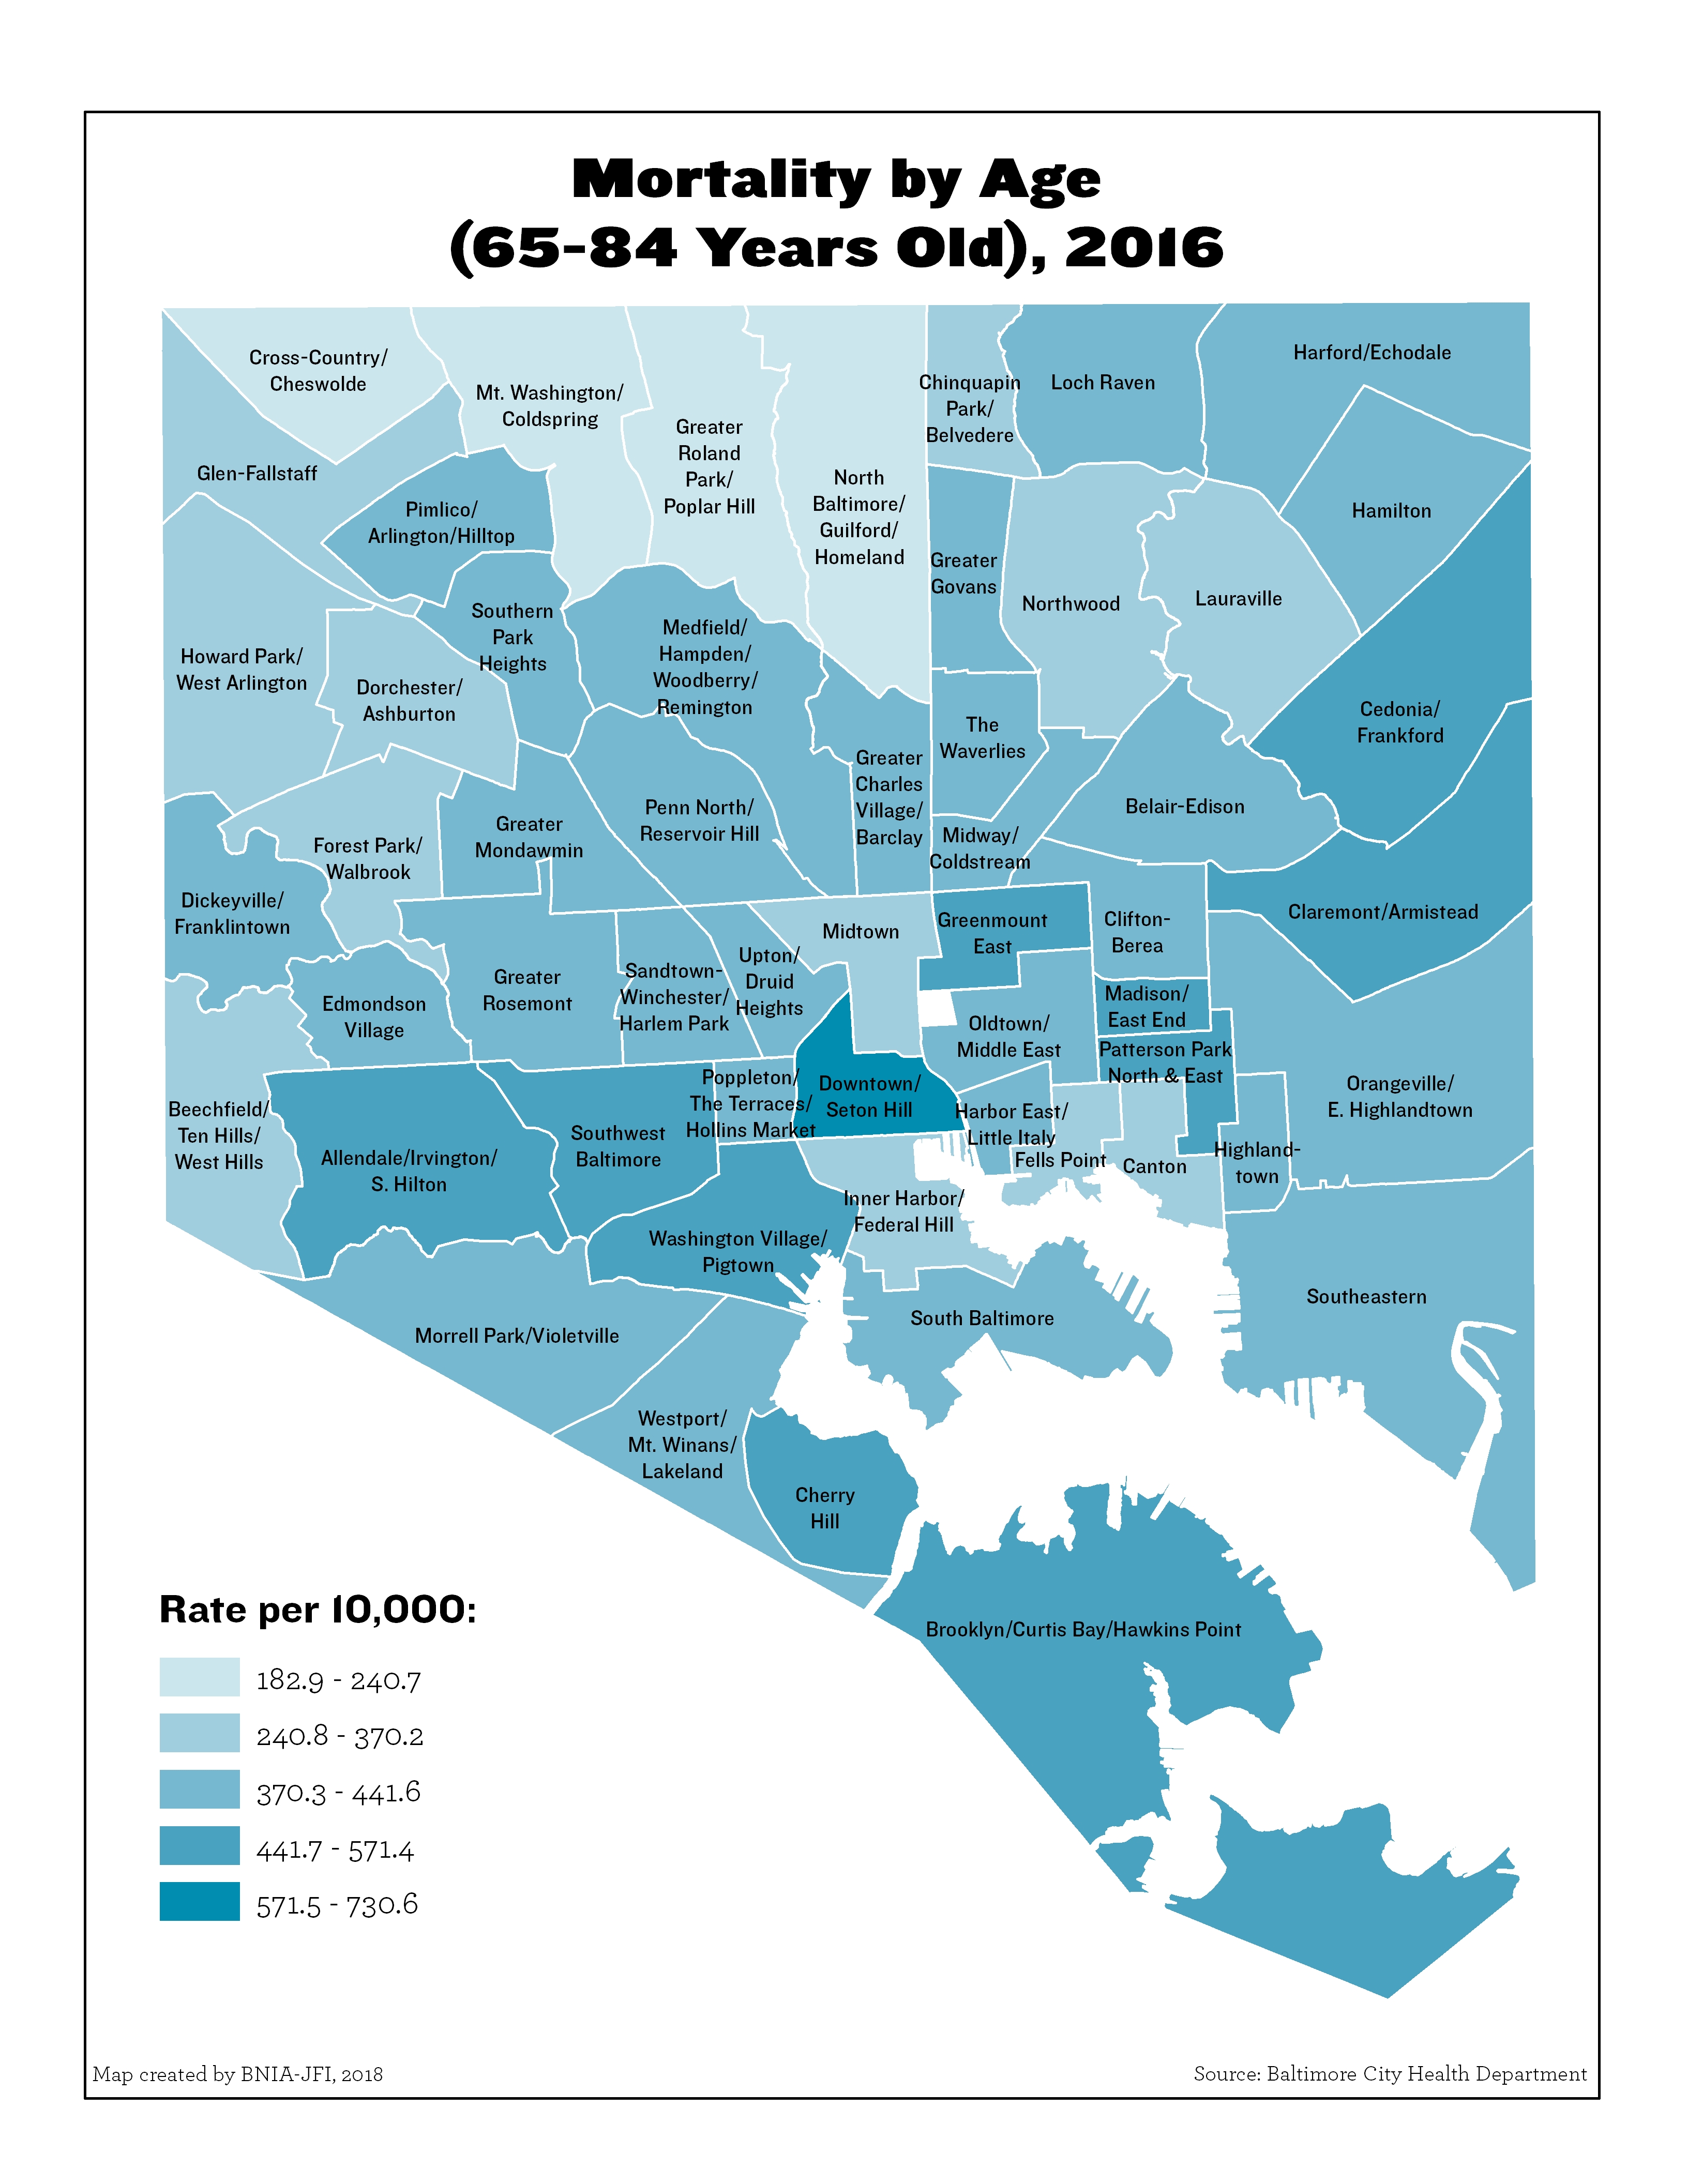
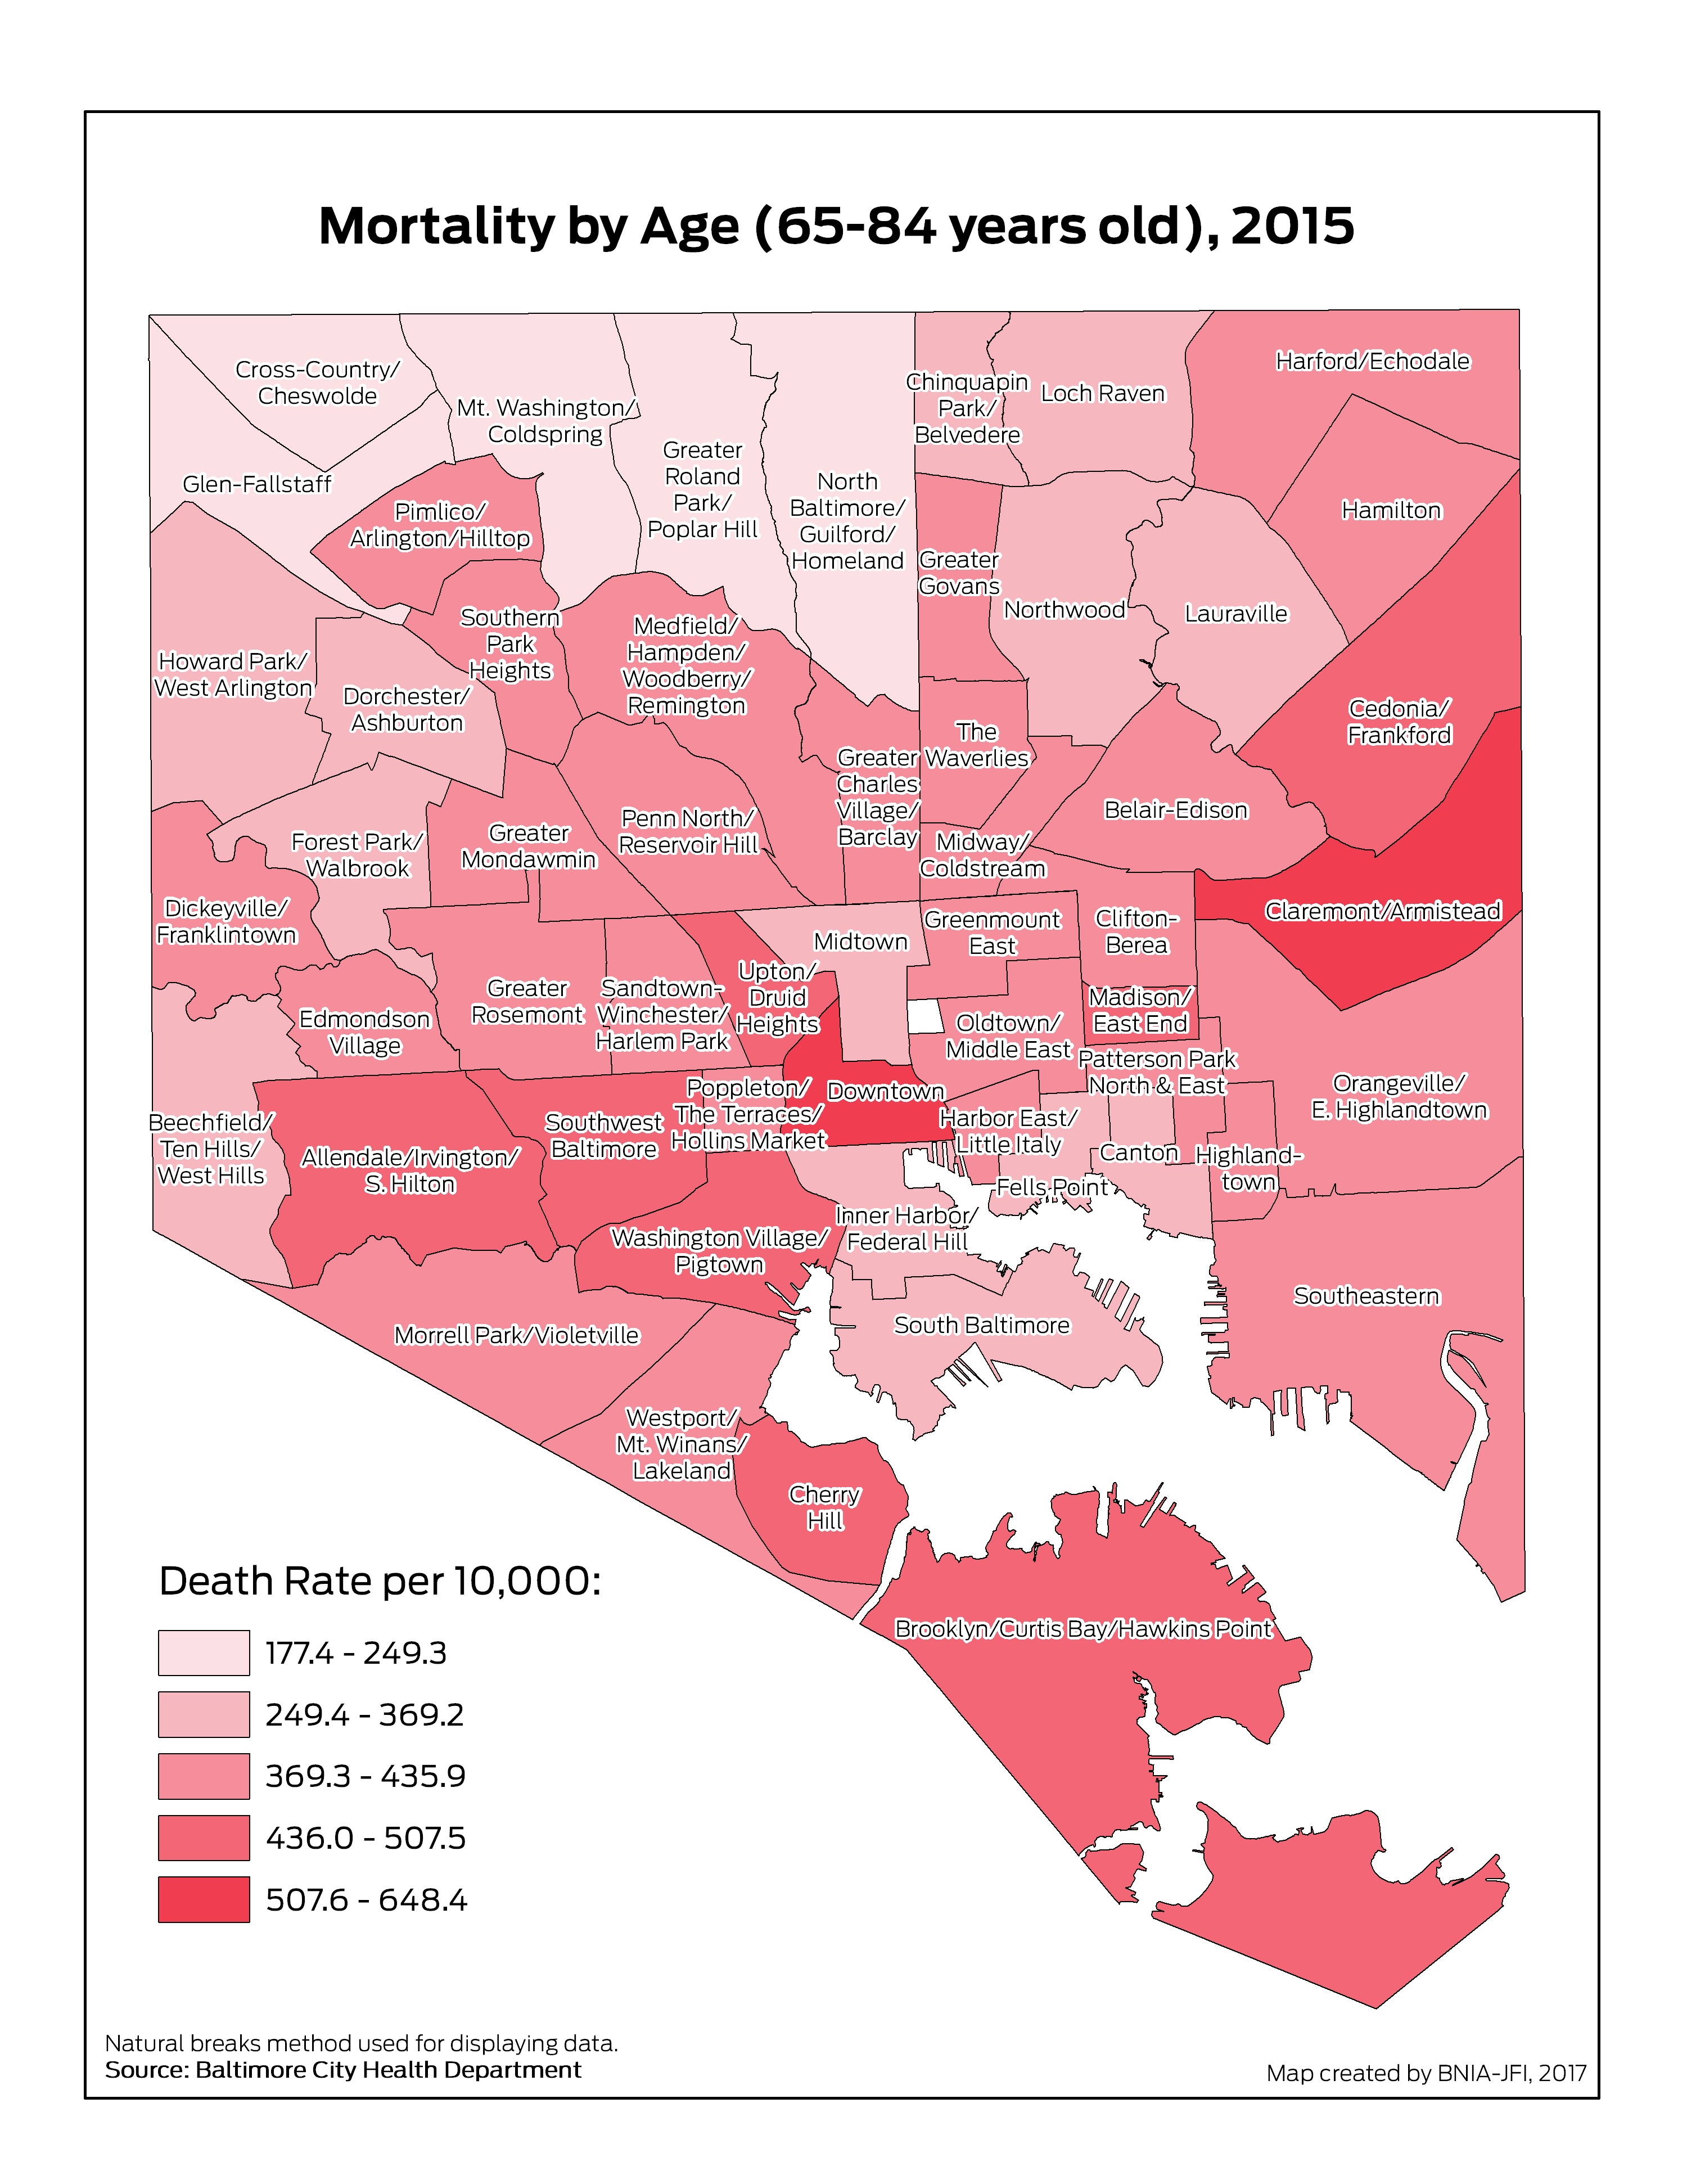
Mortality by Age (65-84 Years Old)
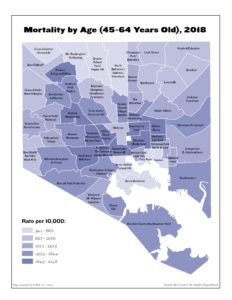
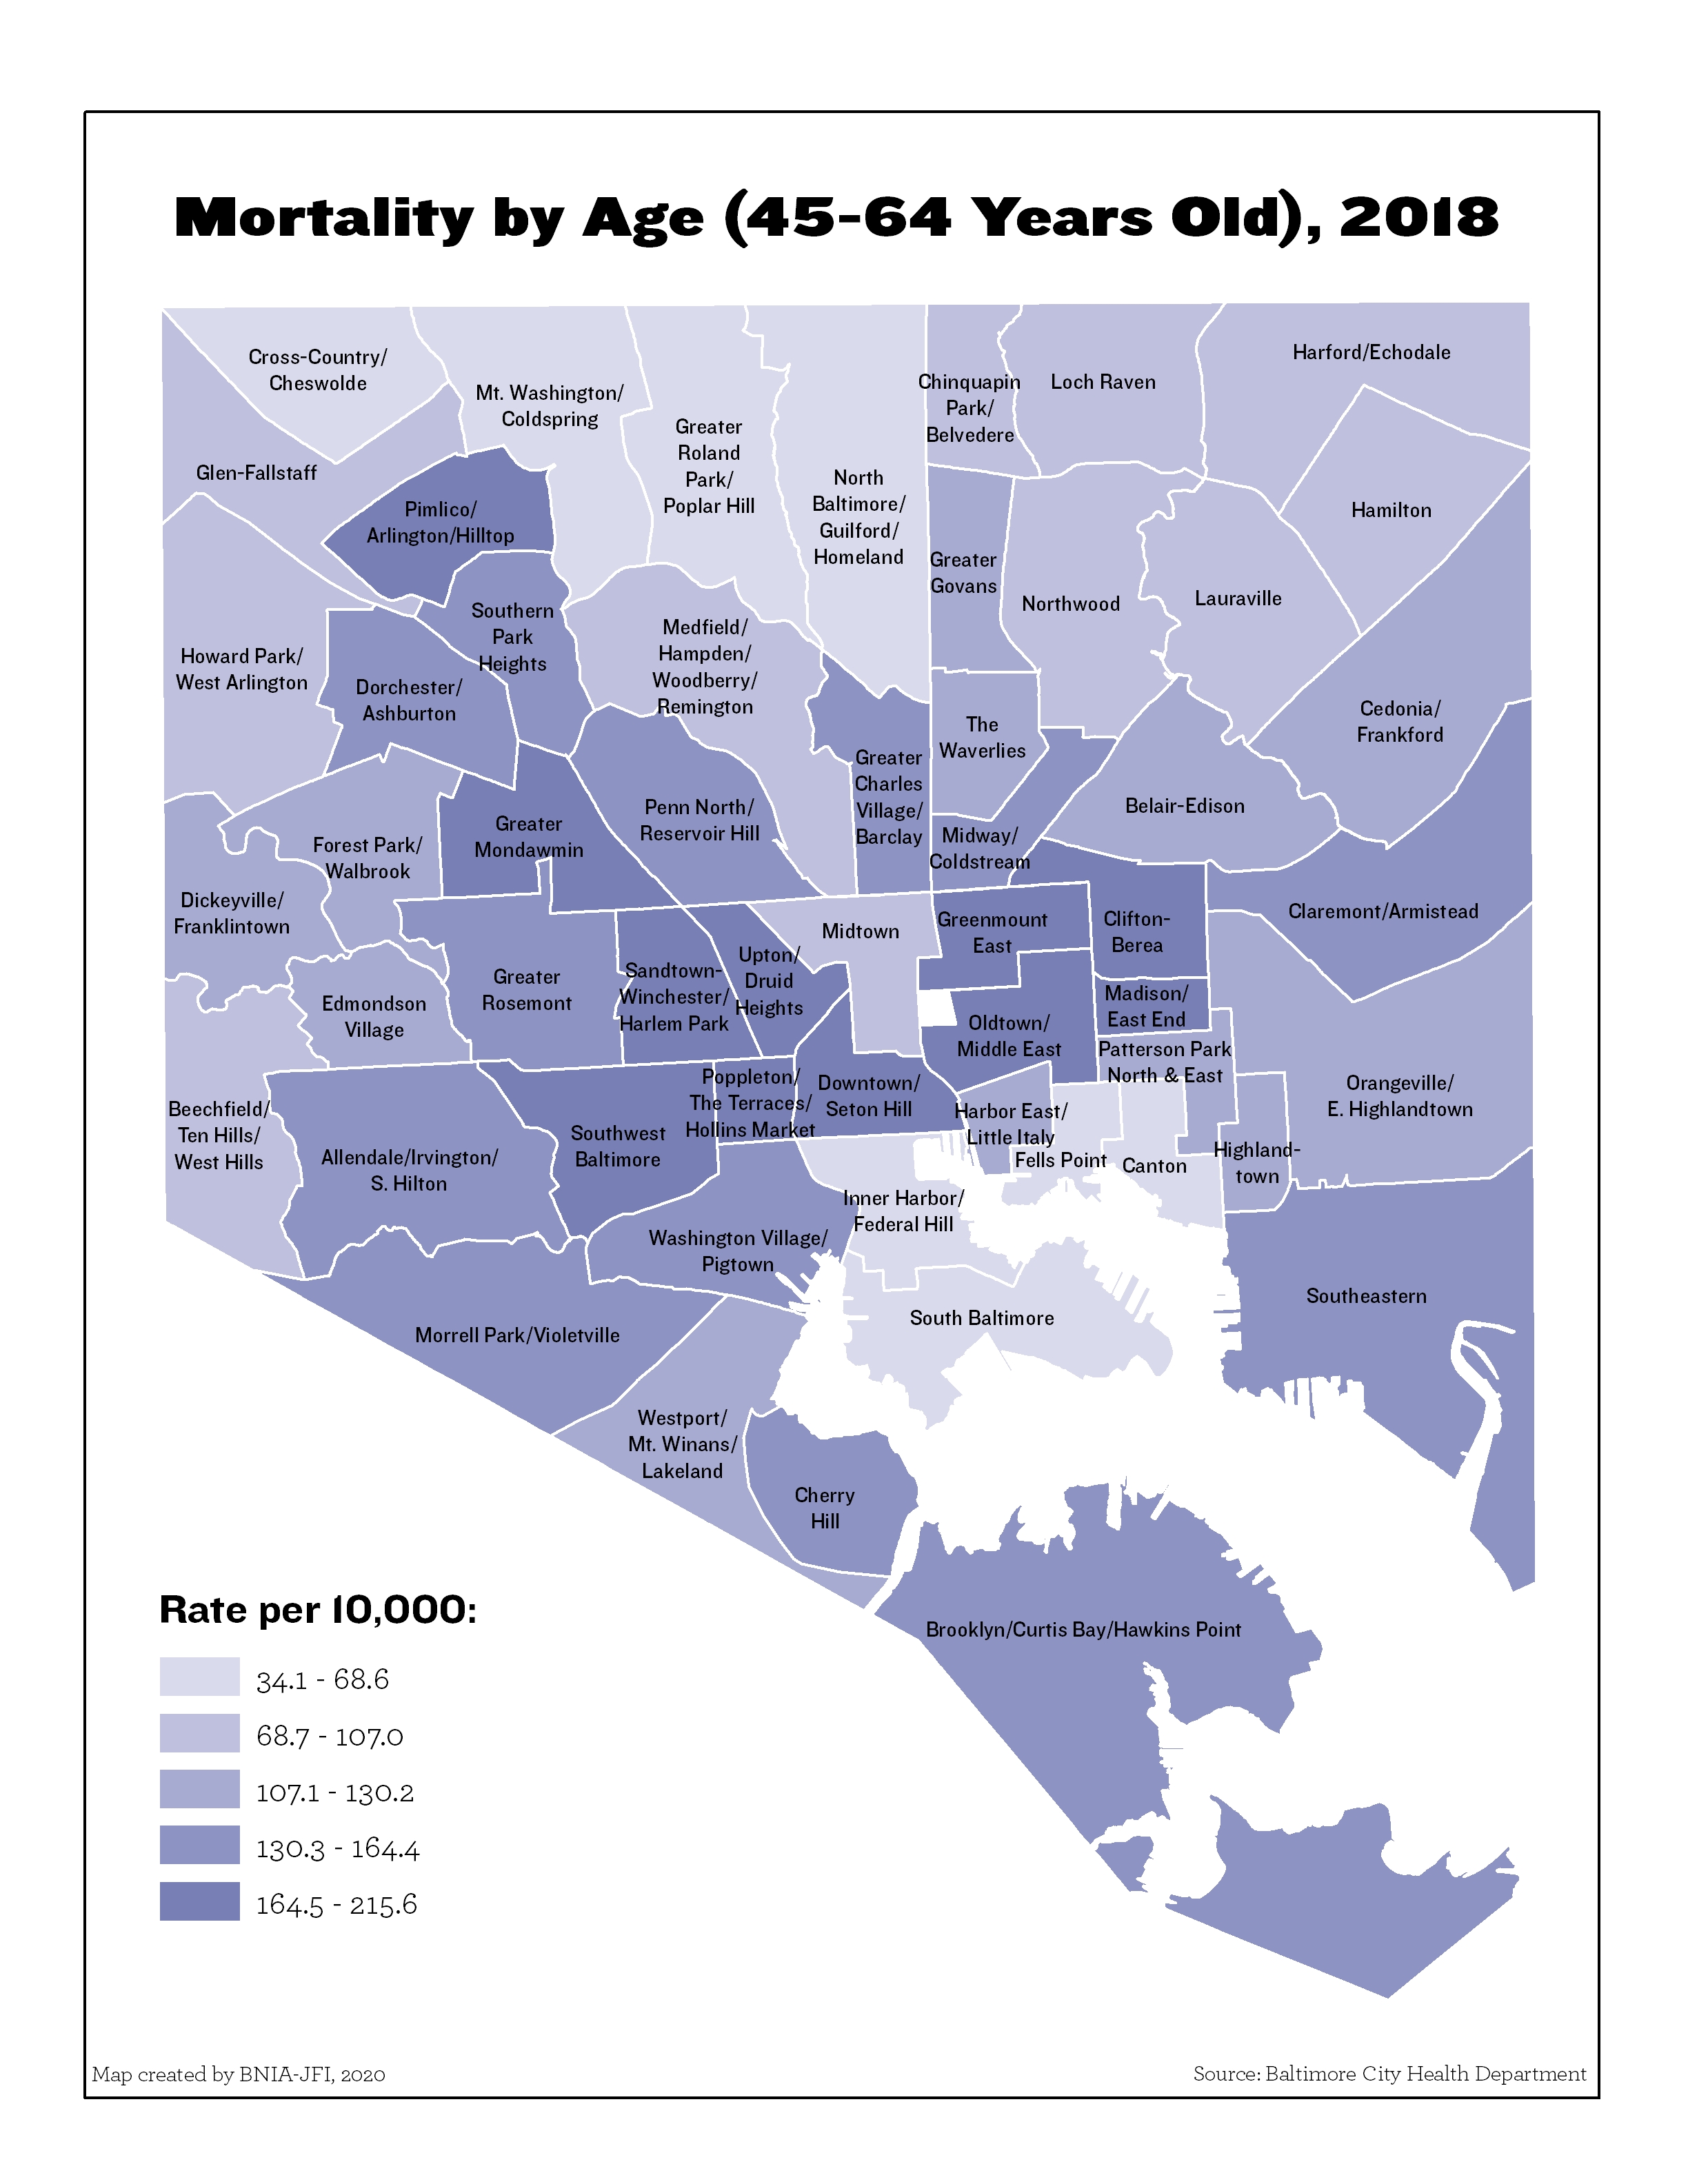
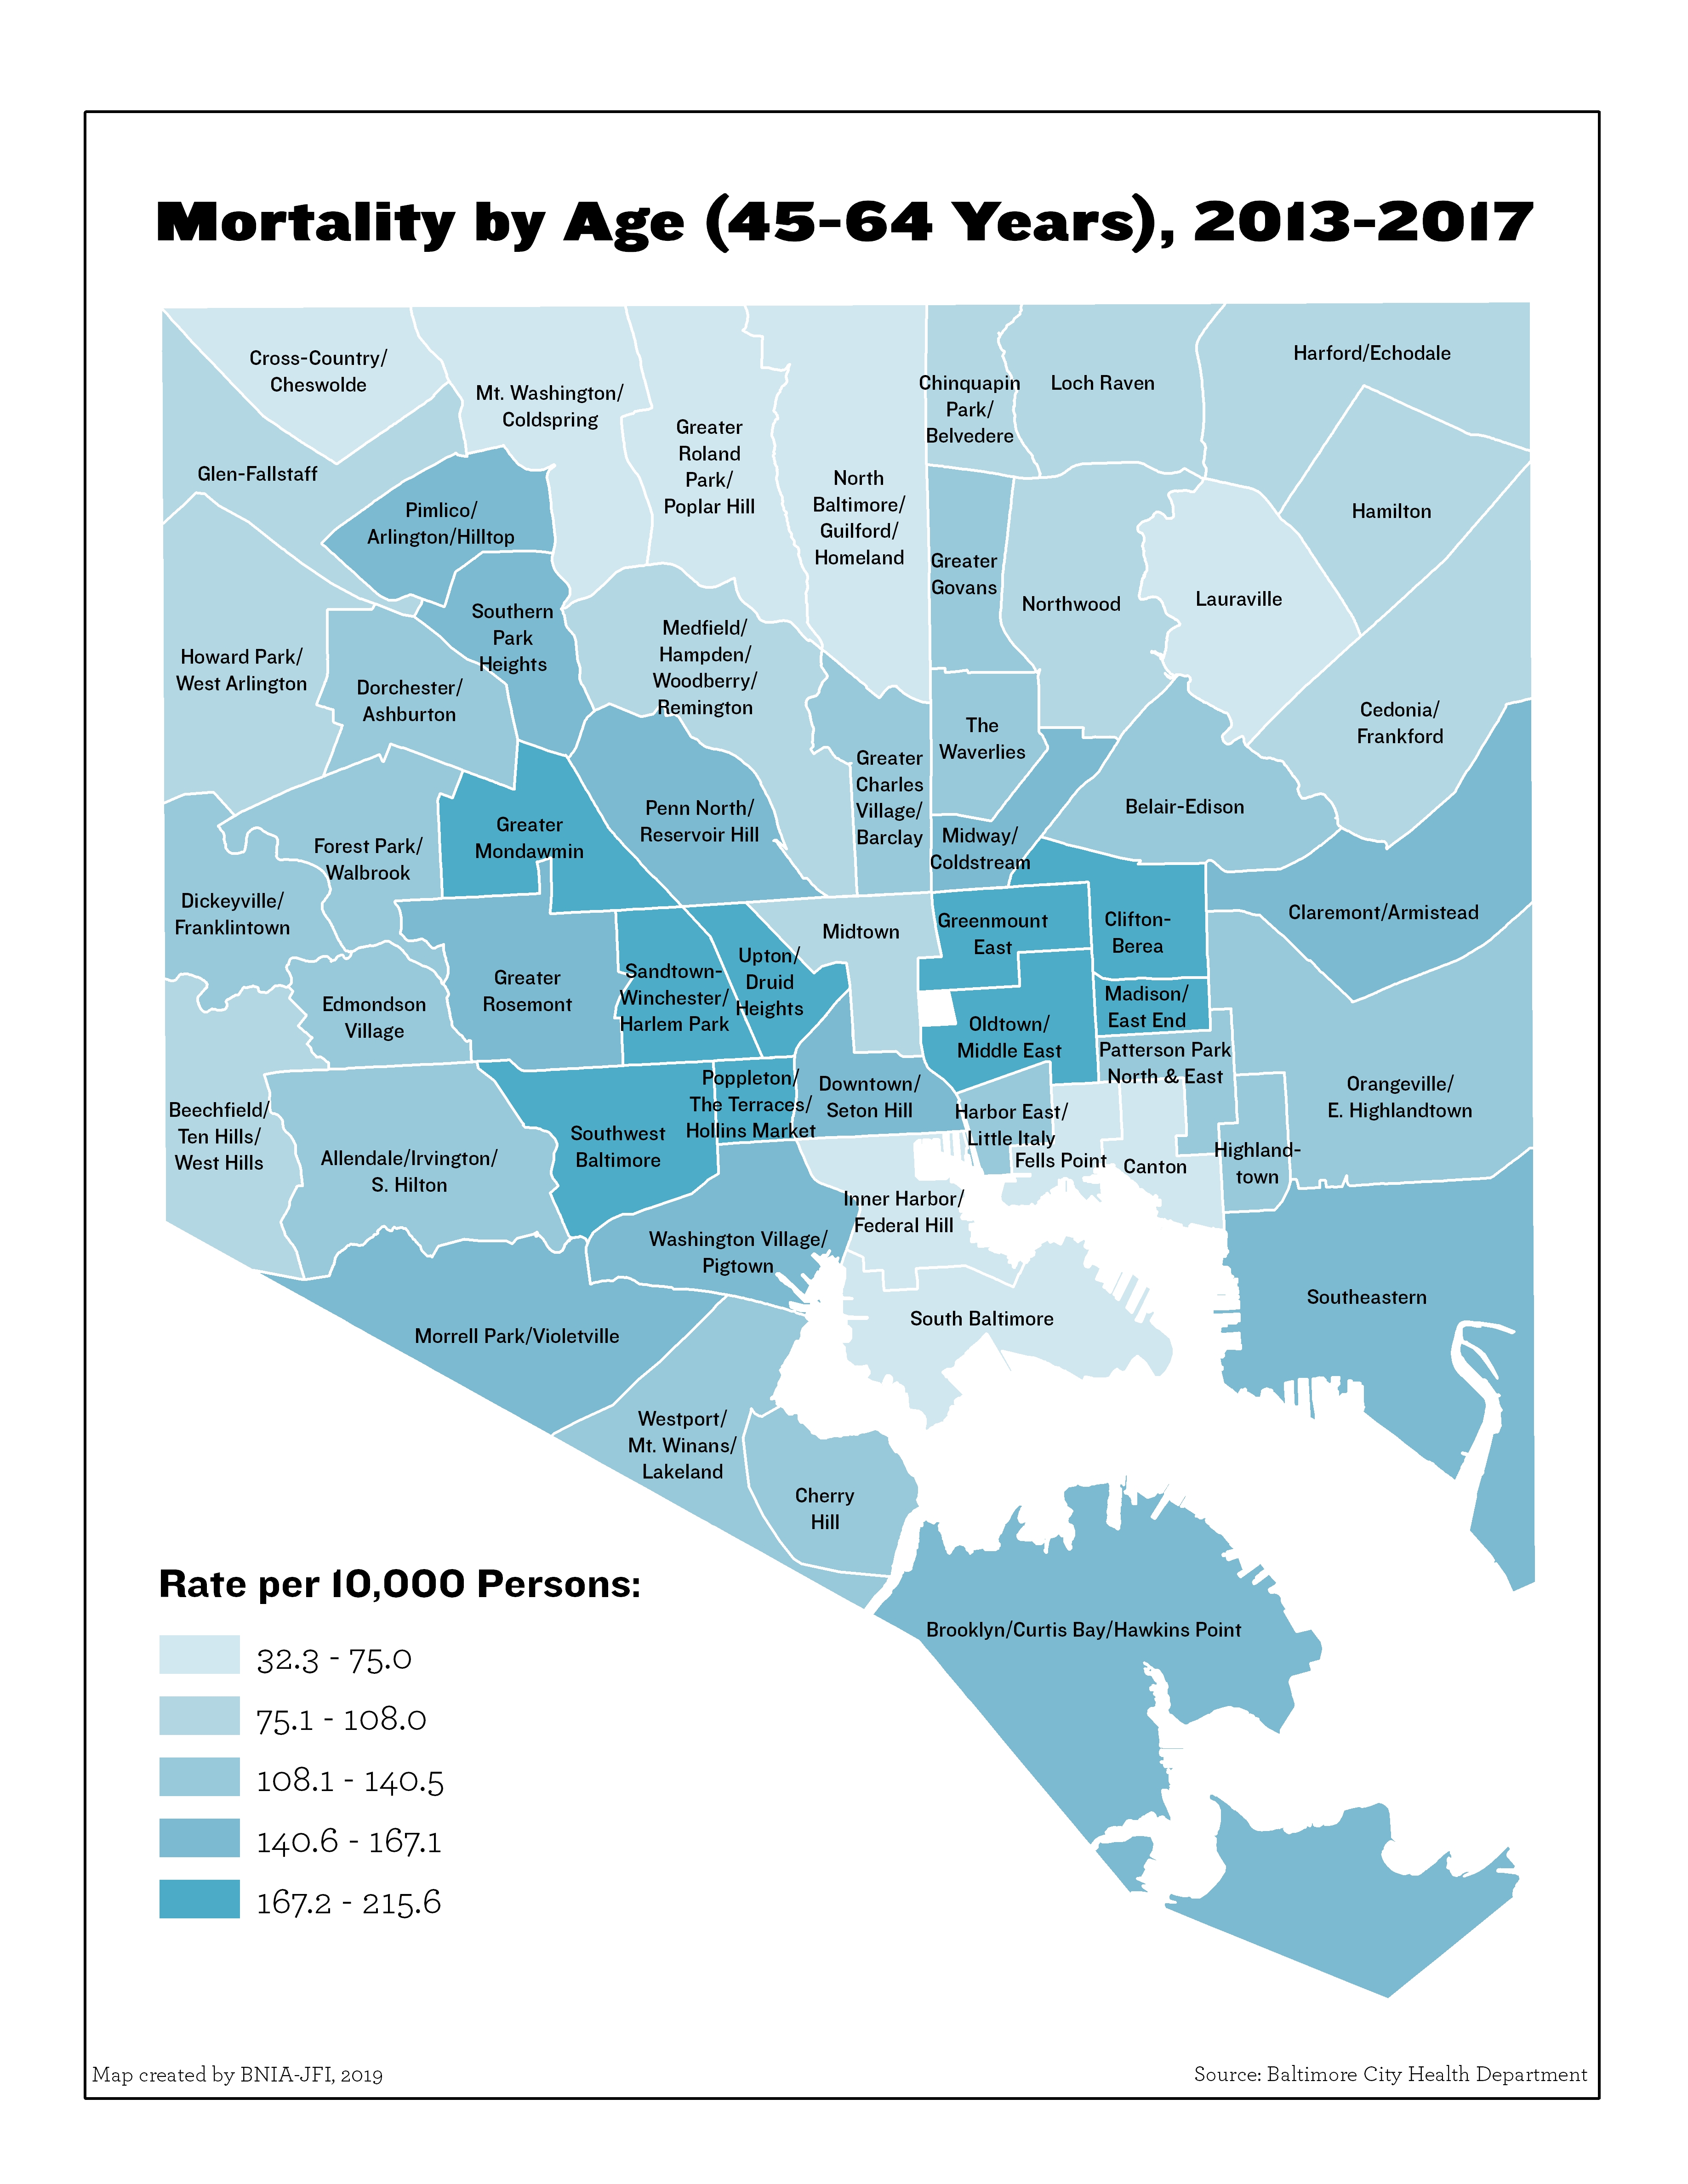
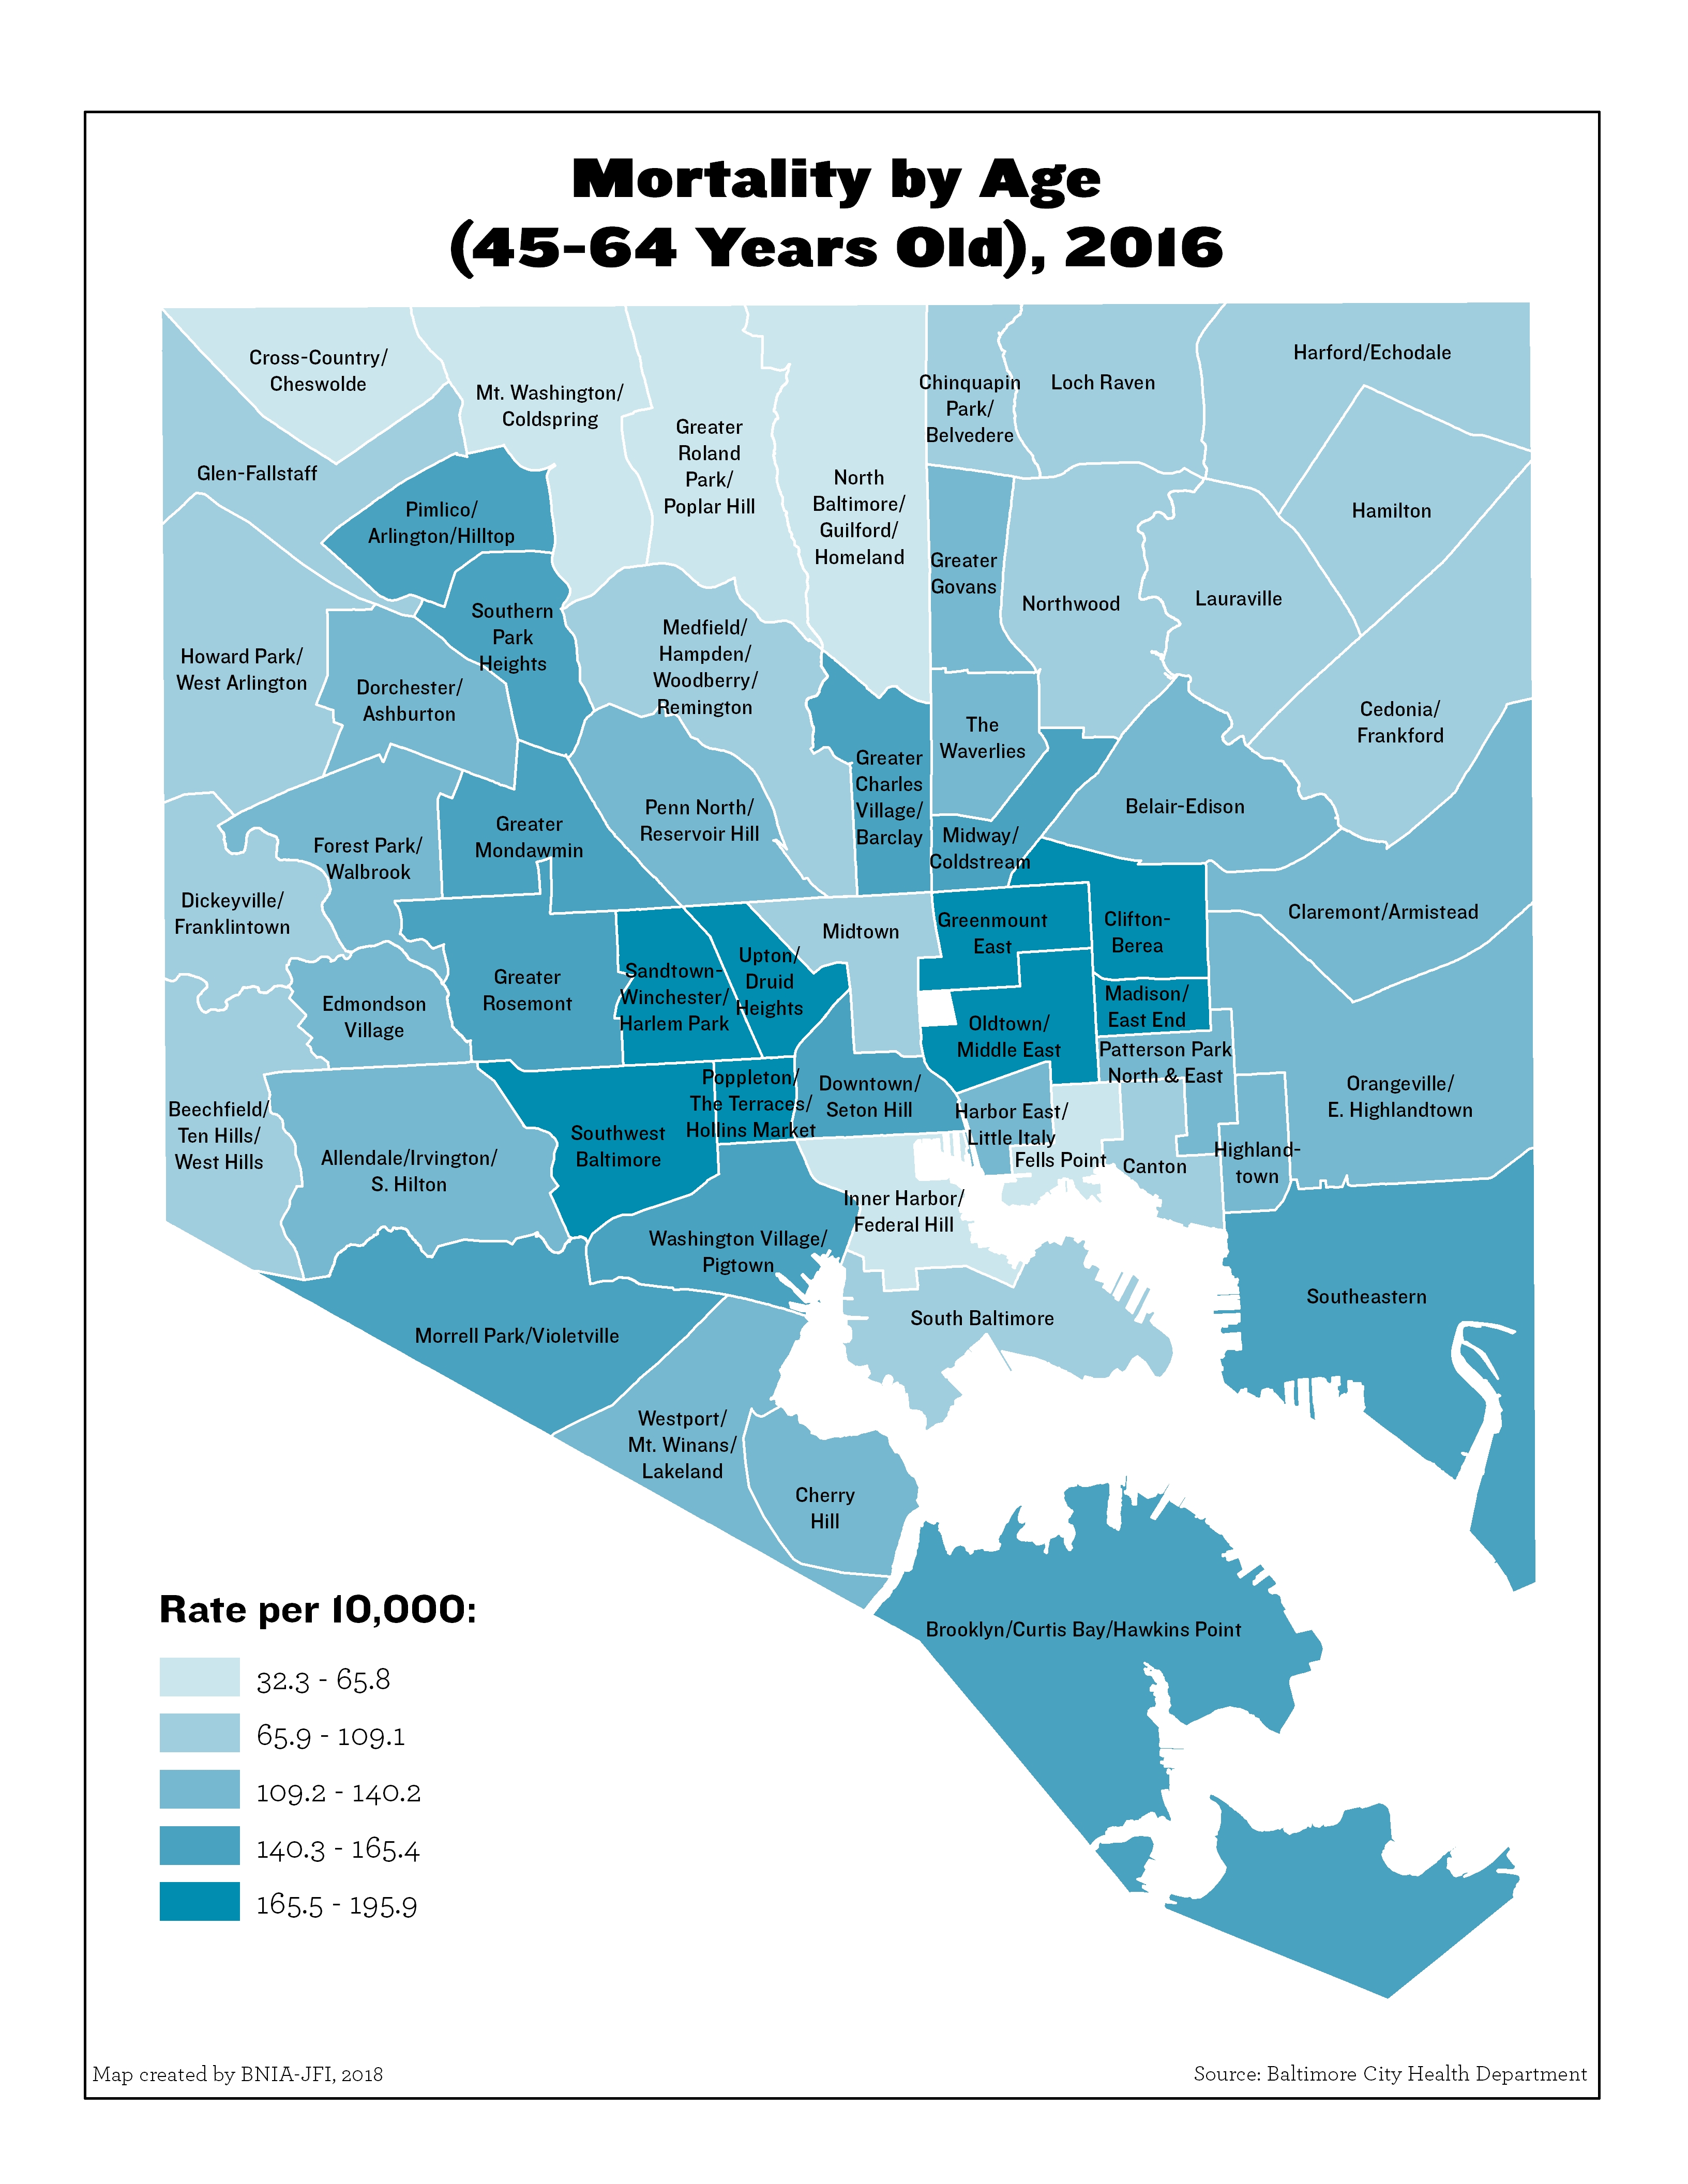
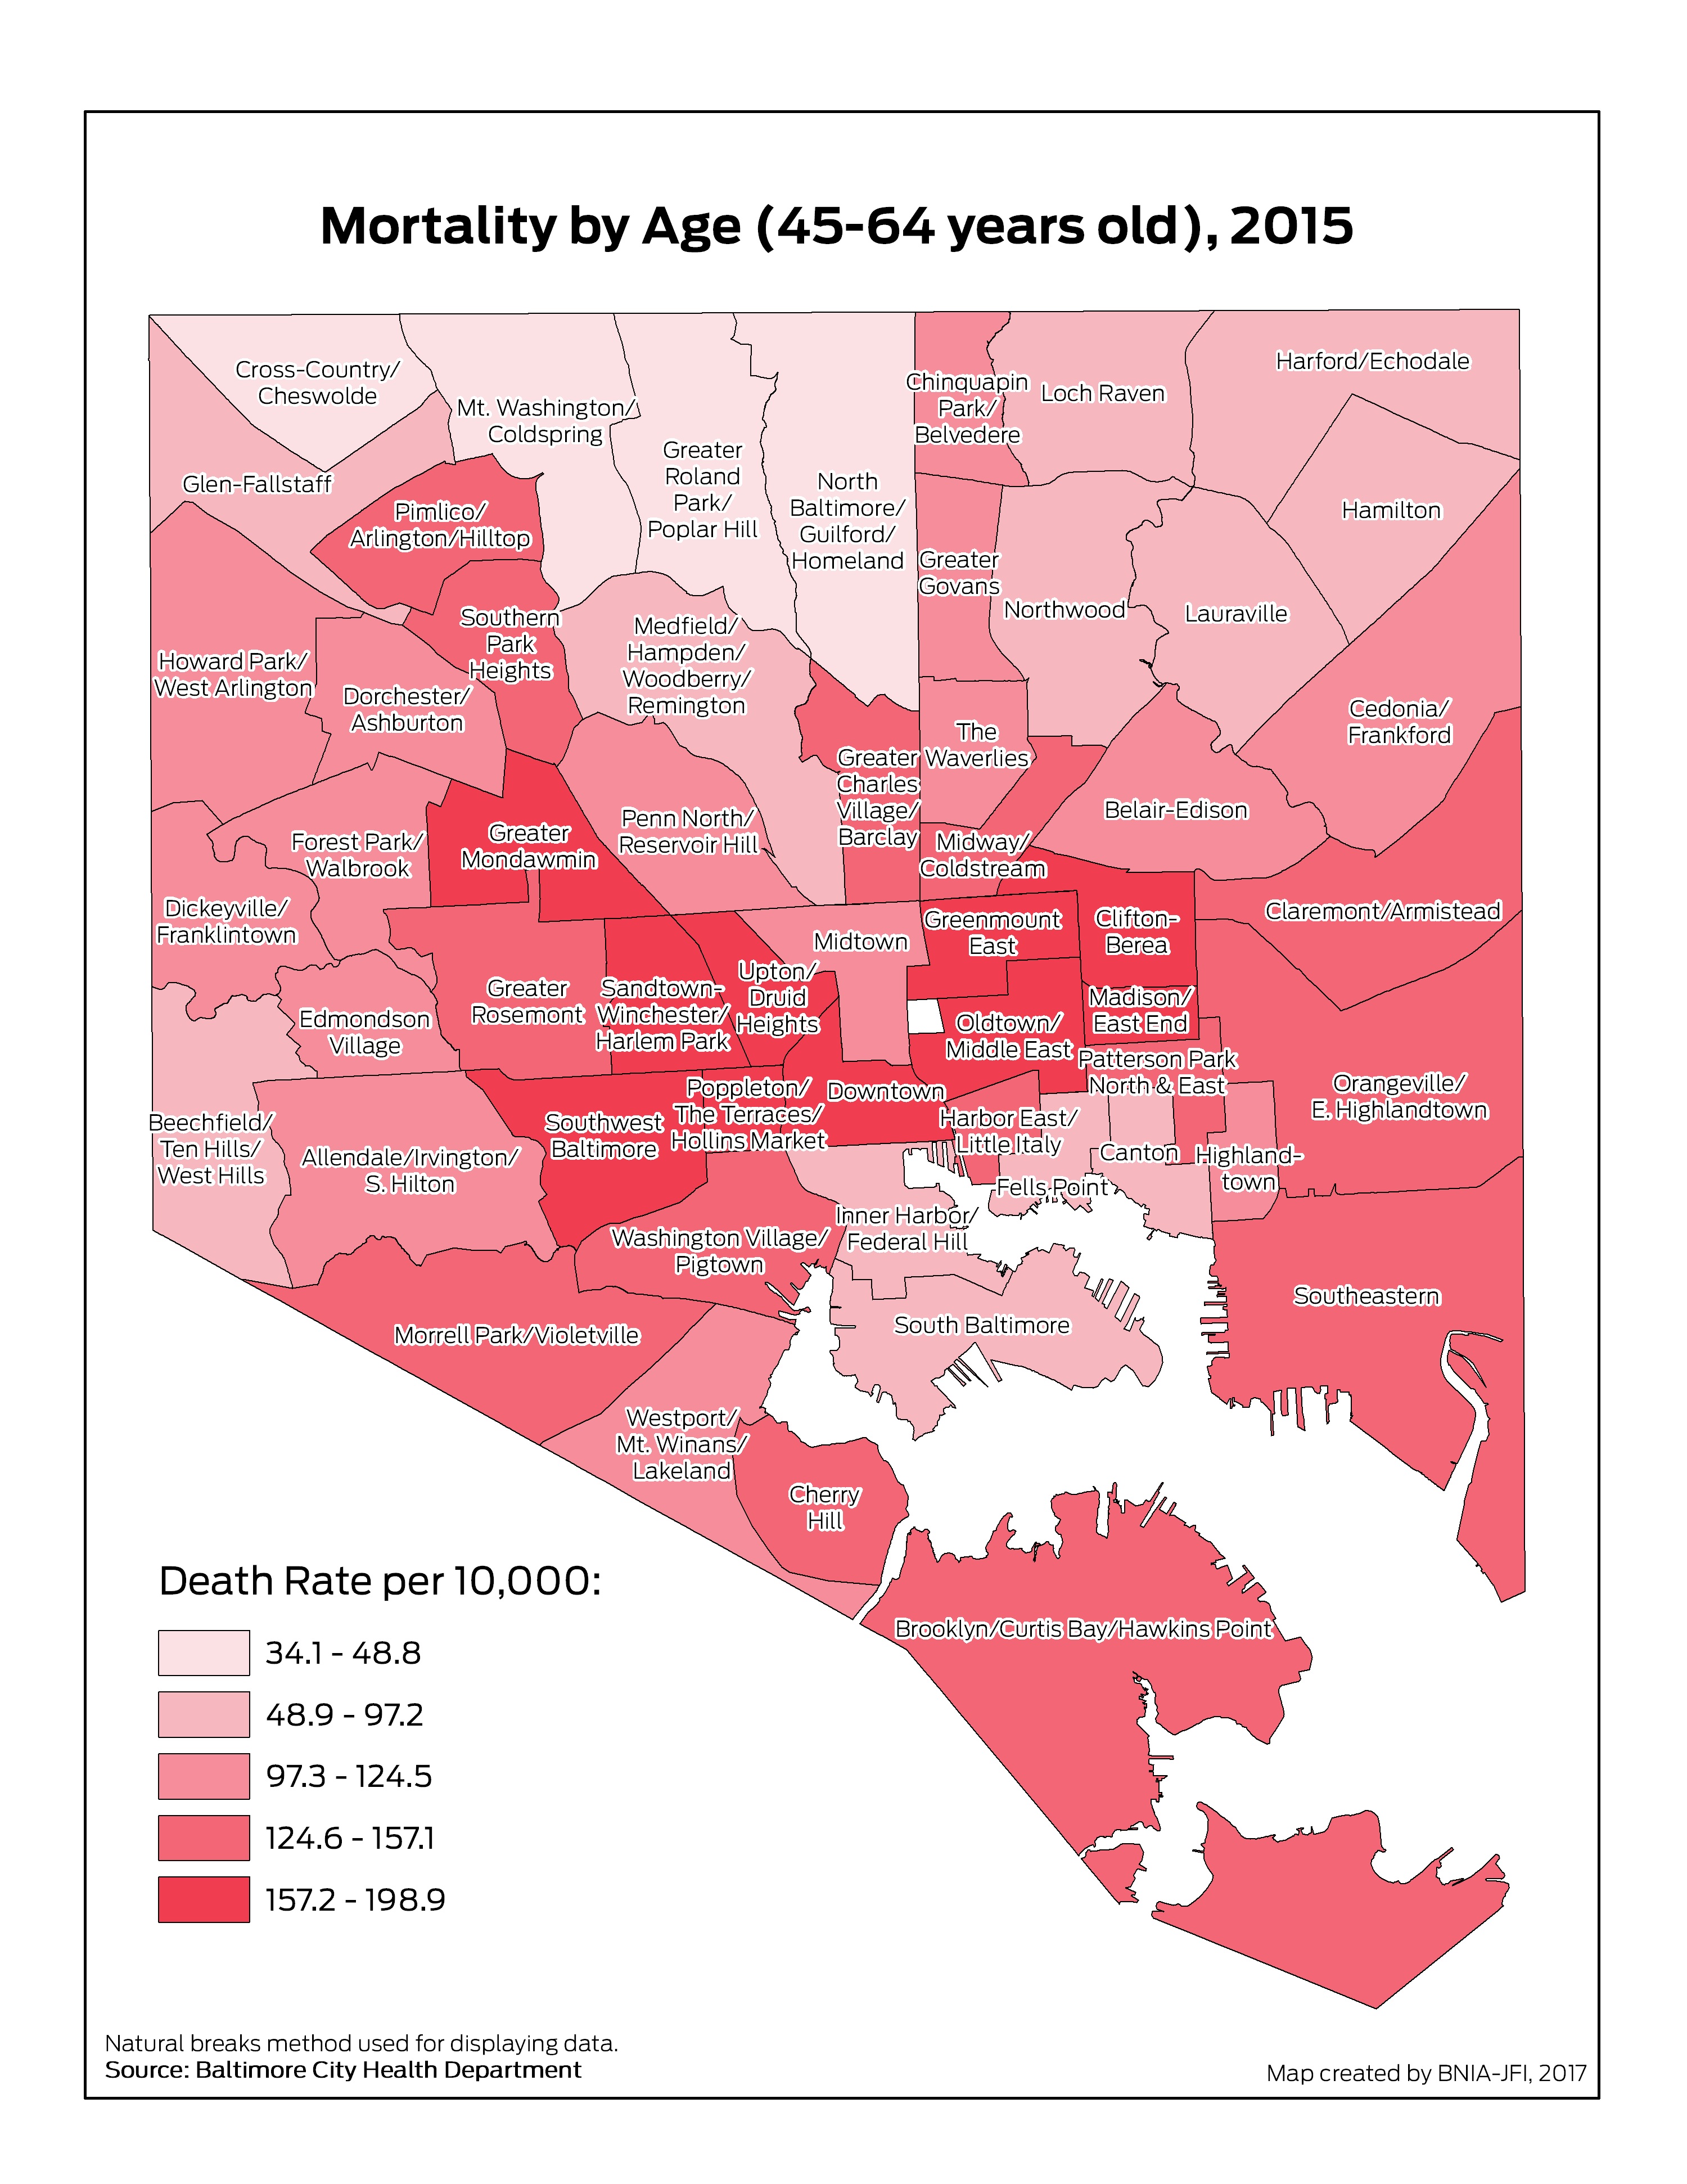
Mortality by Age (45-64 Years Old)
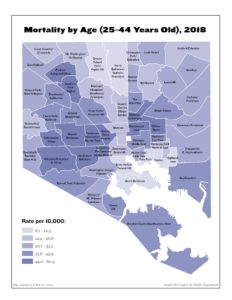
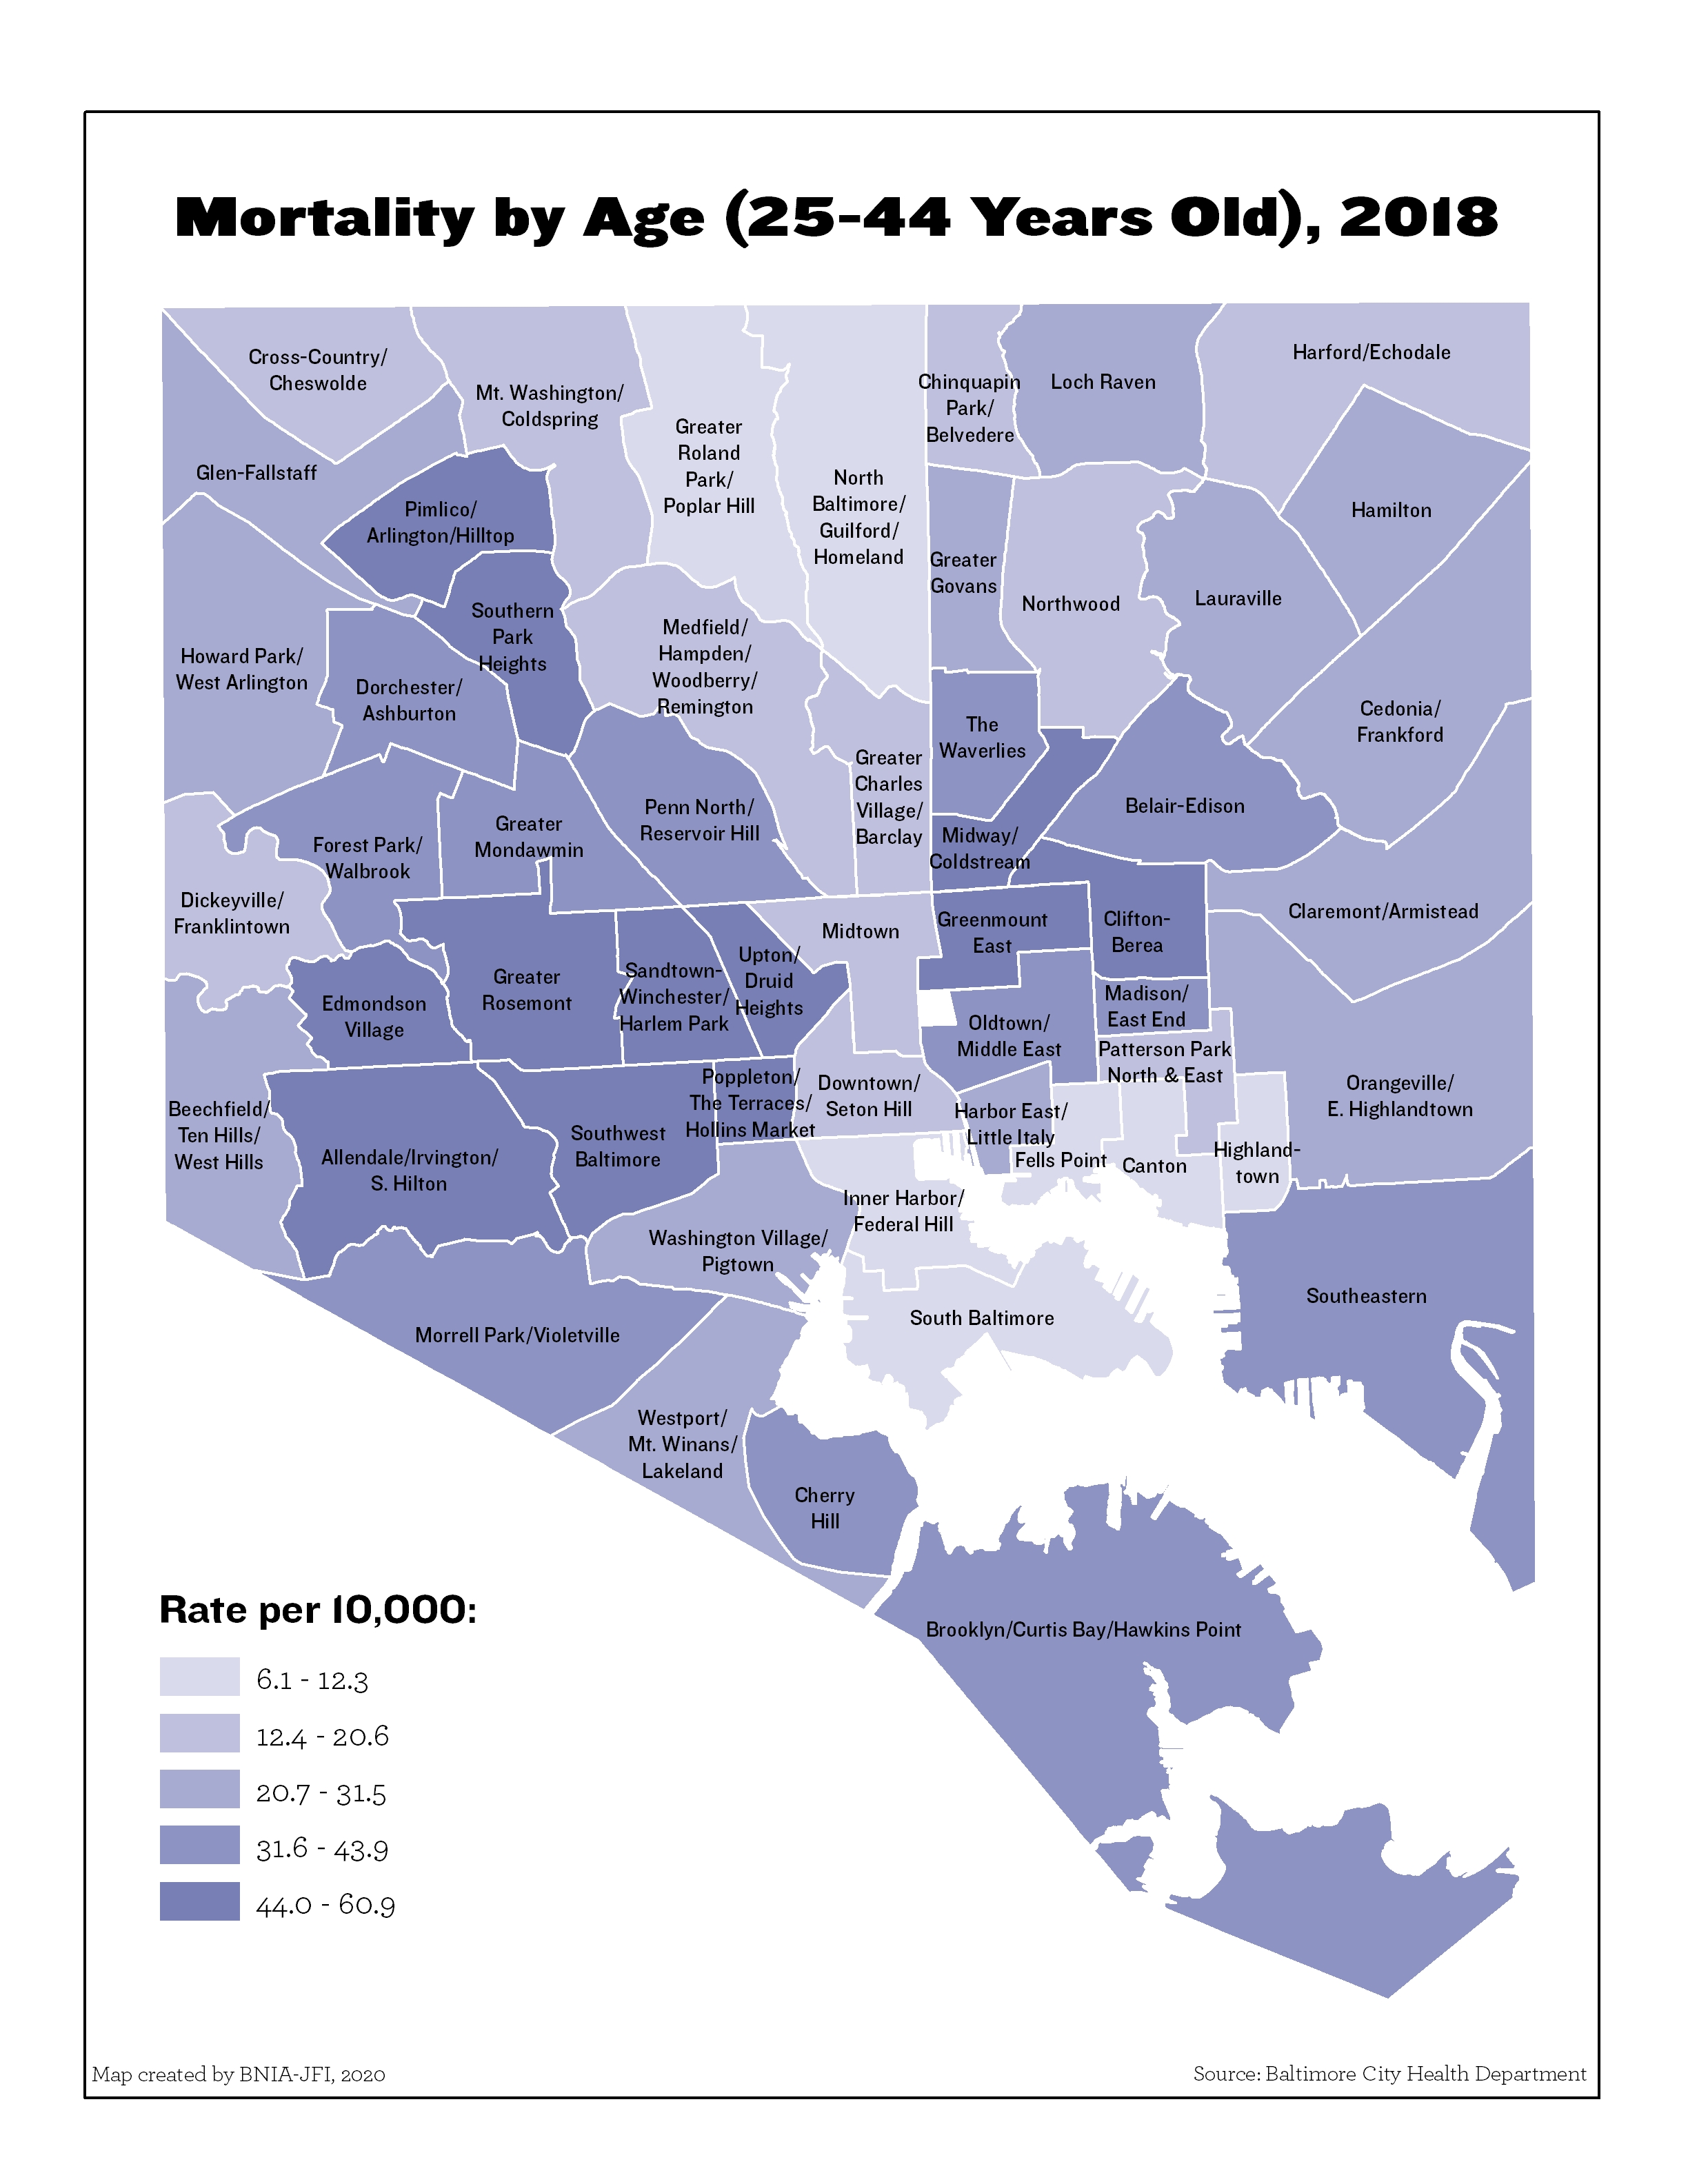
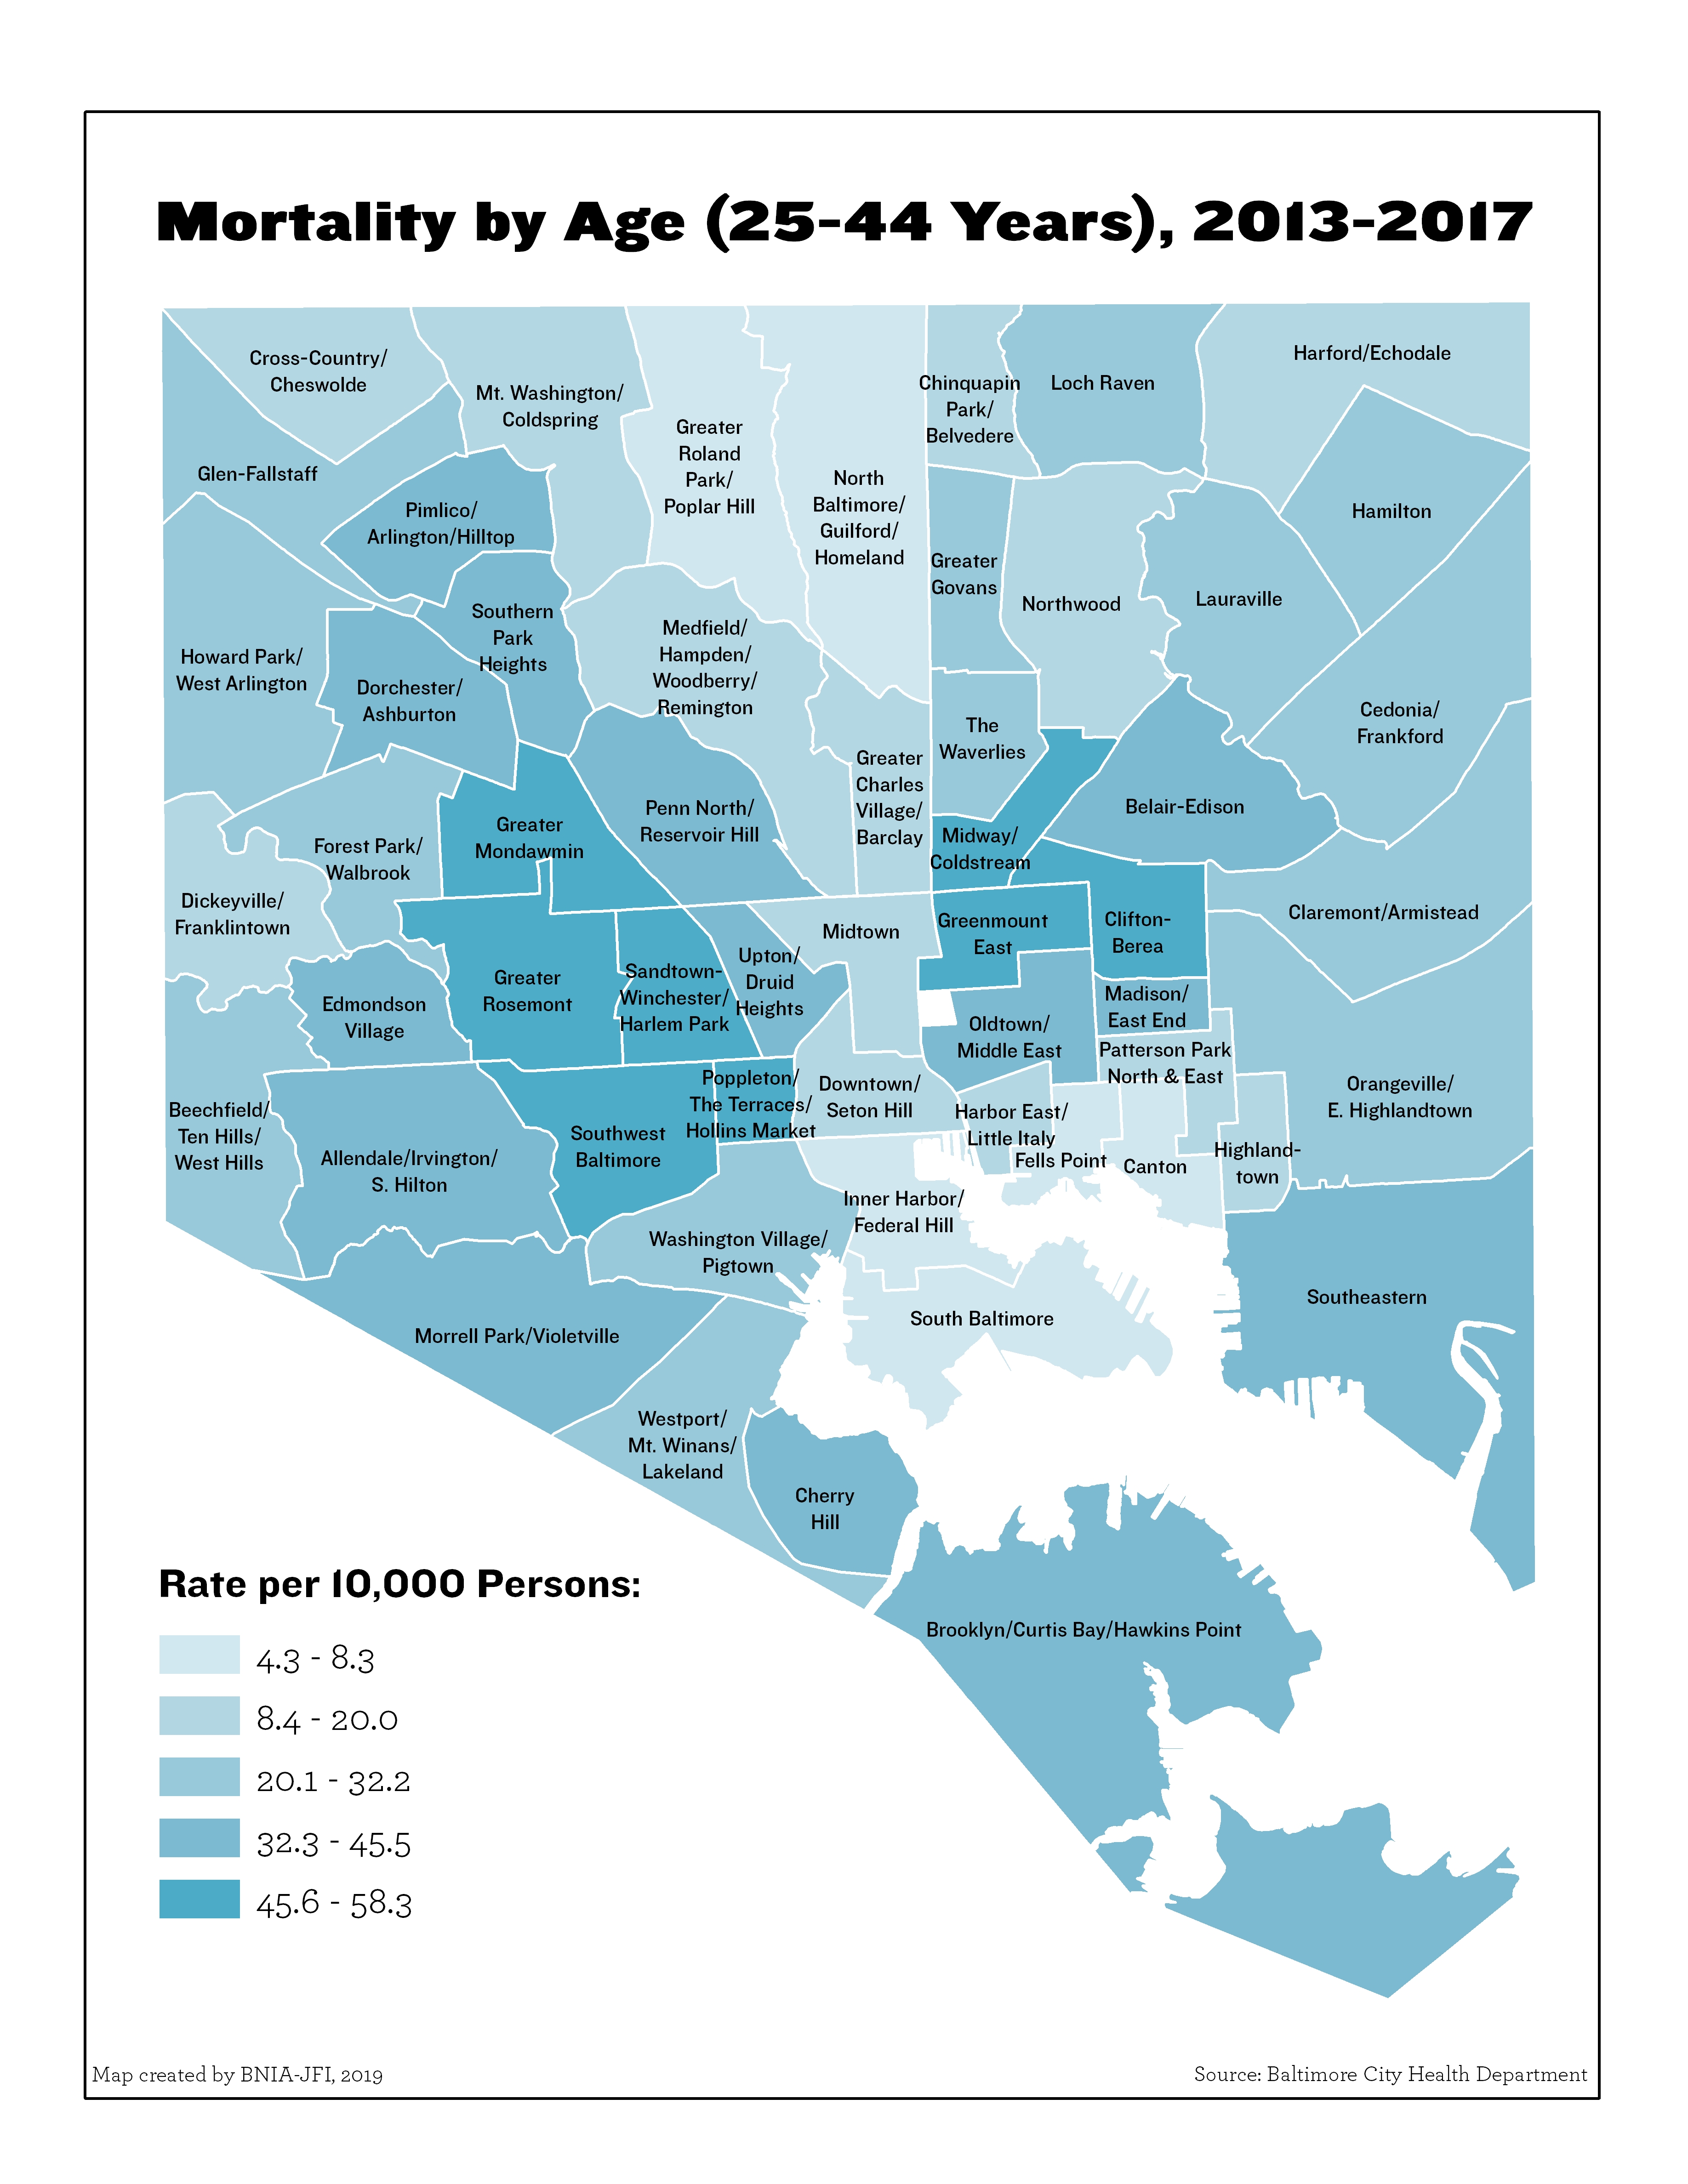
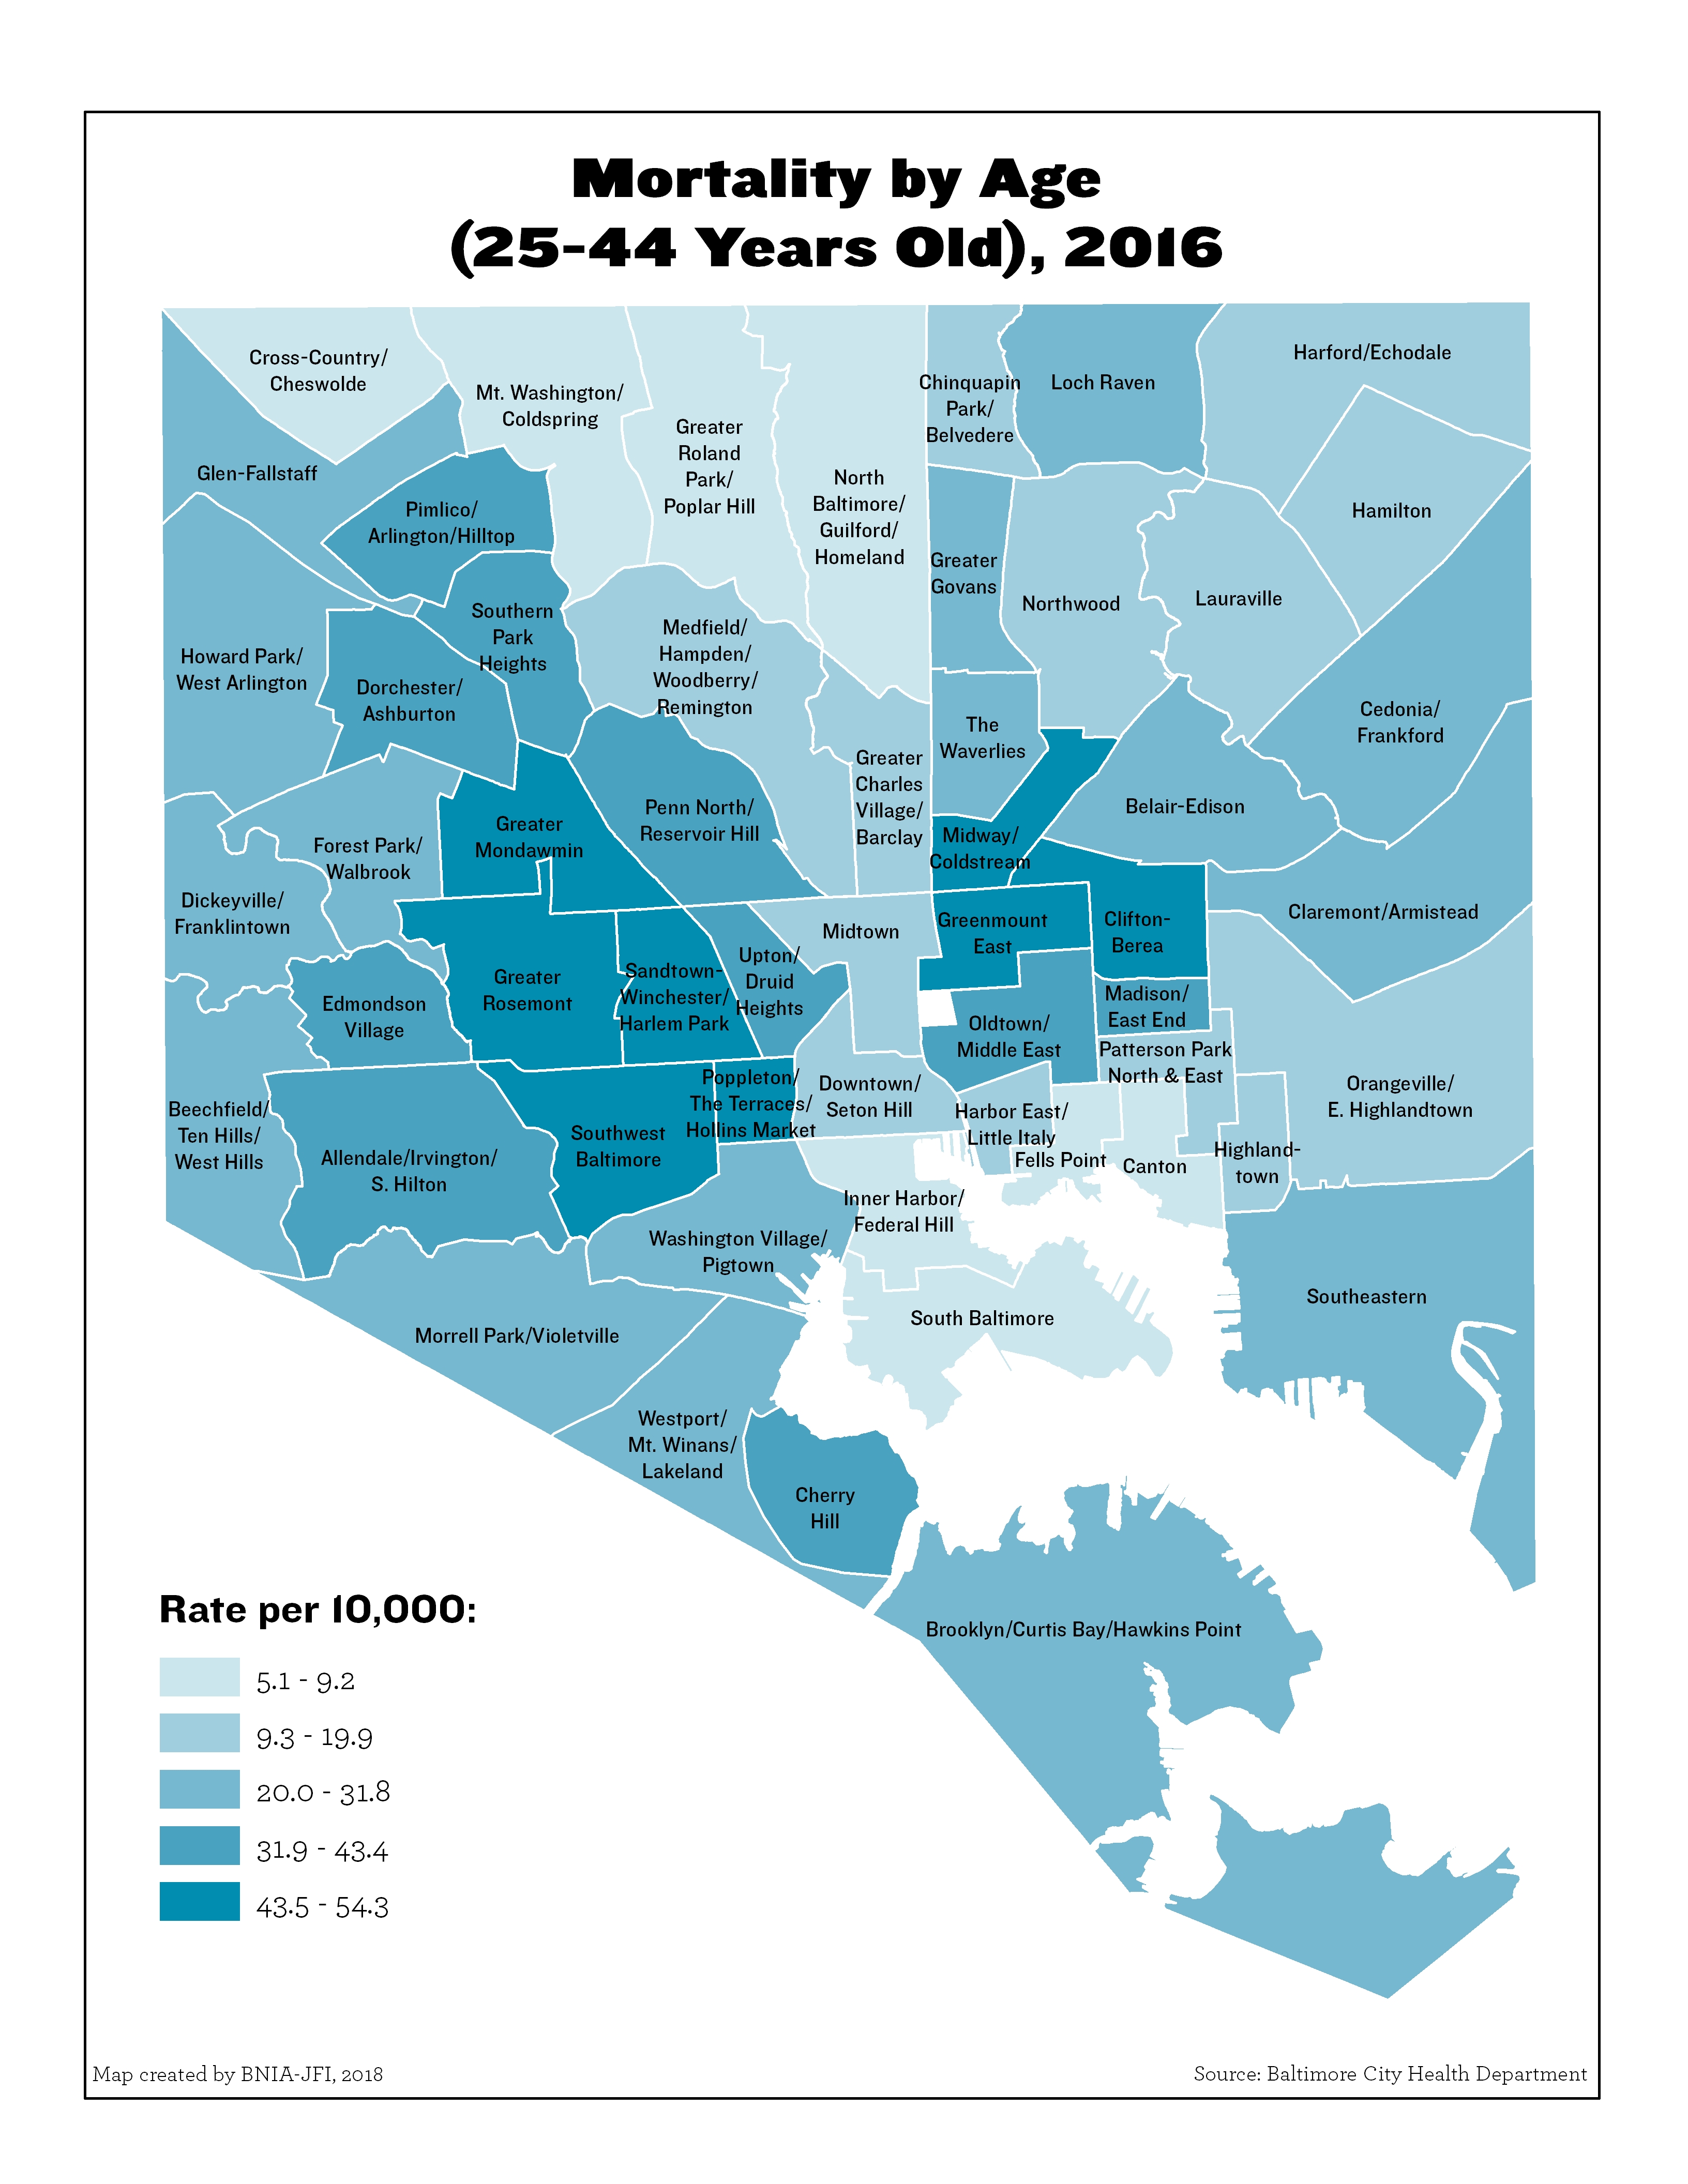
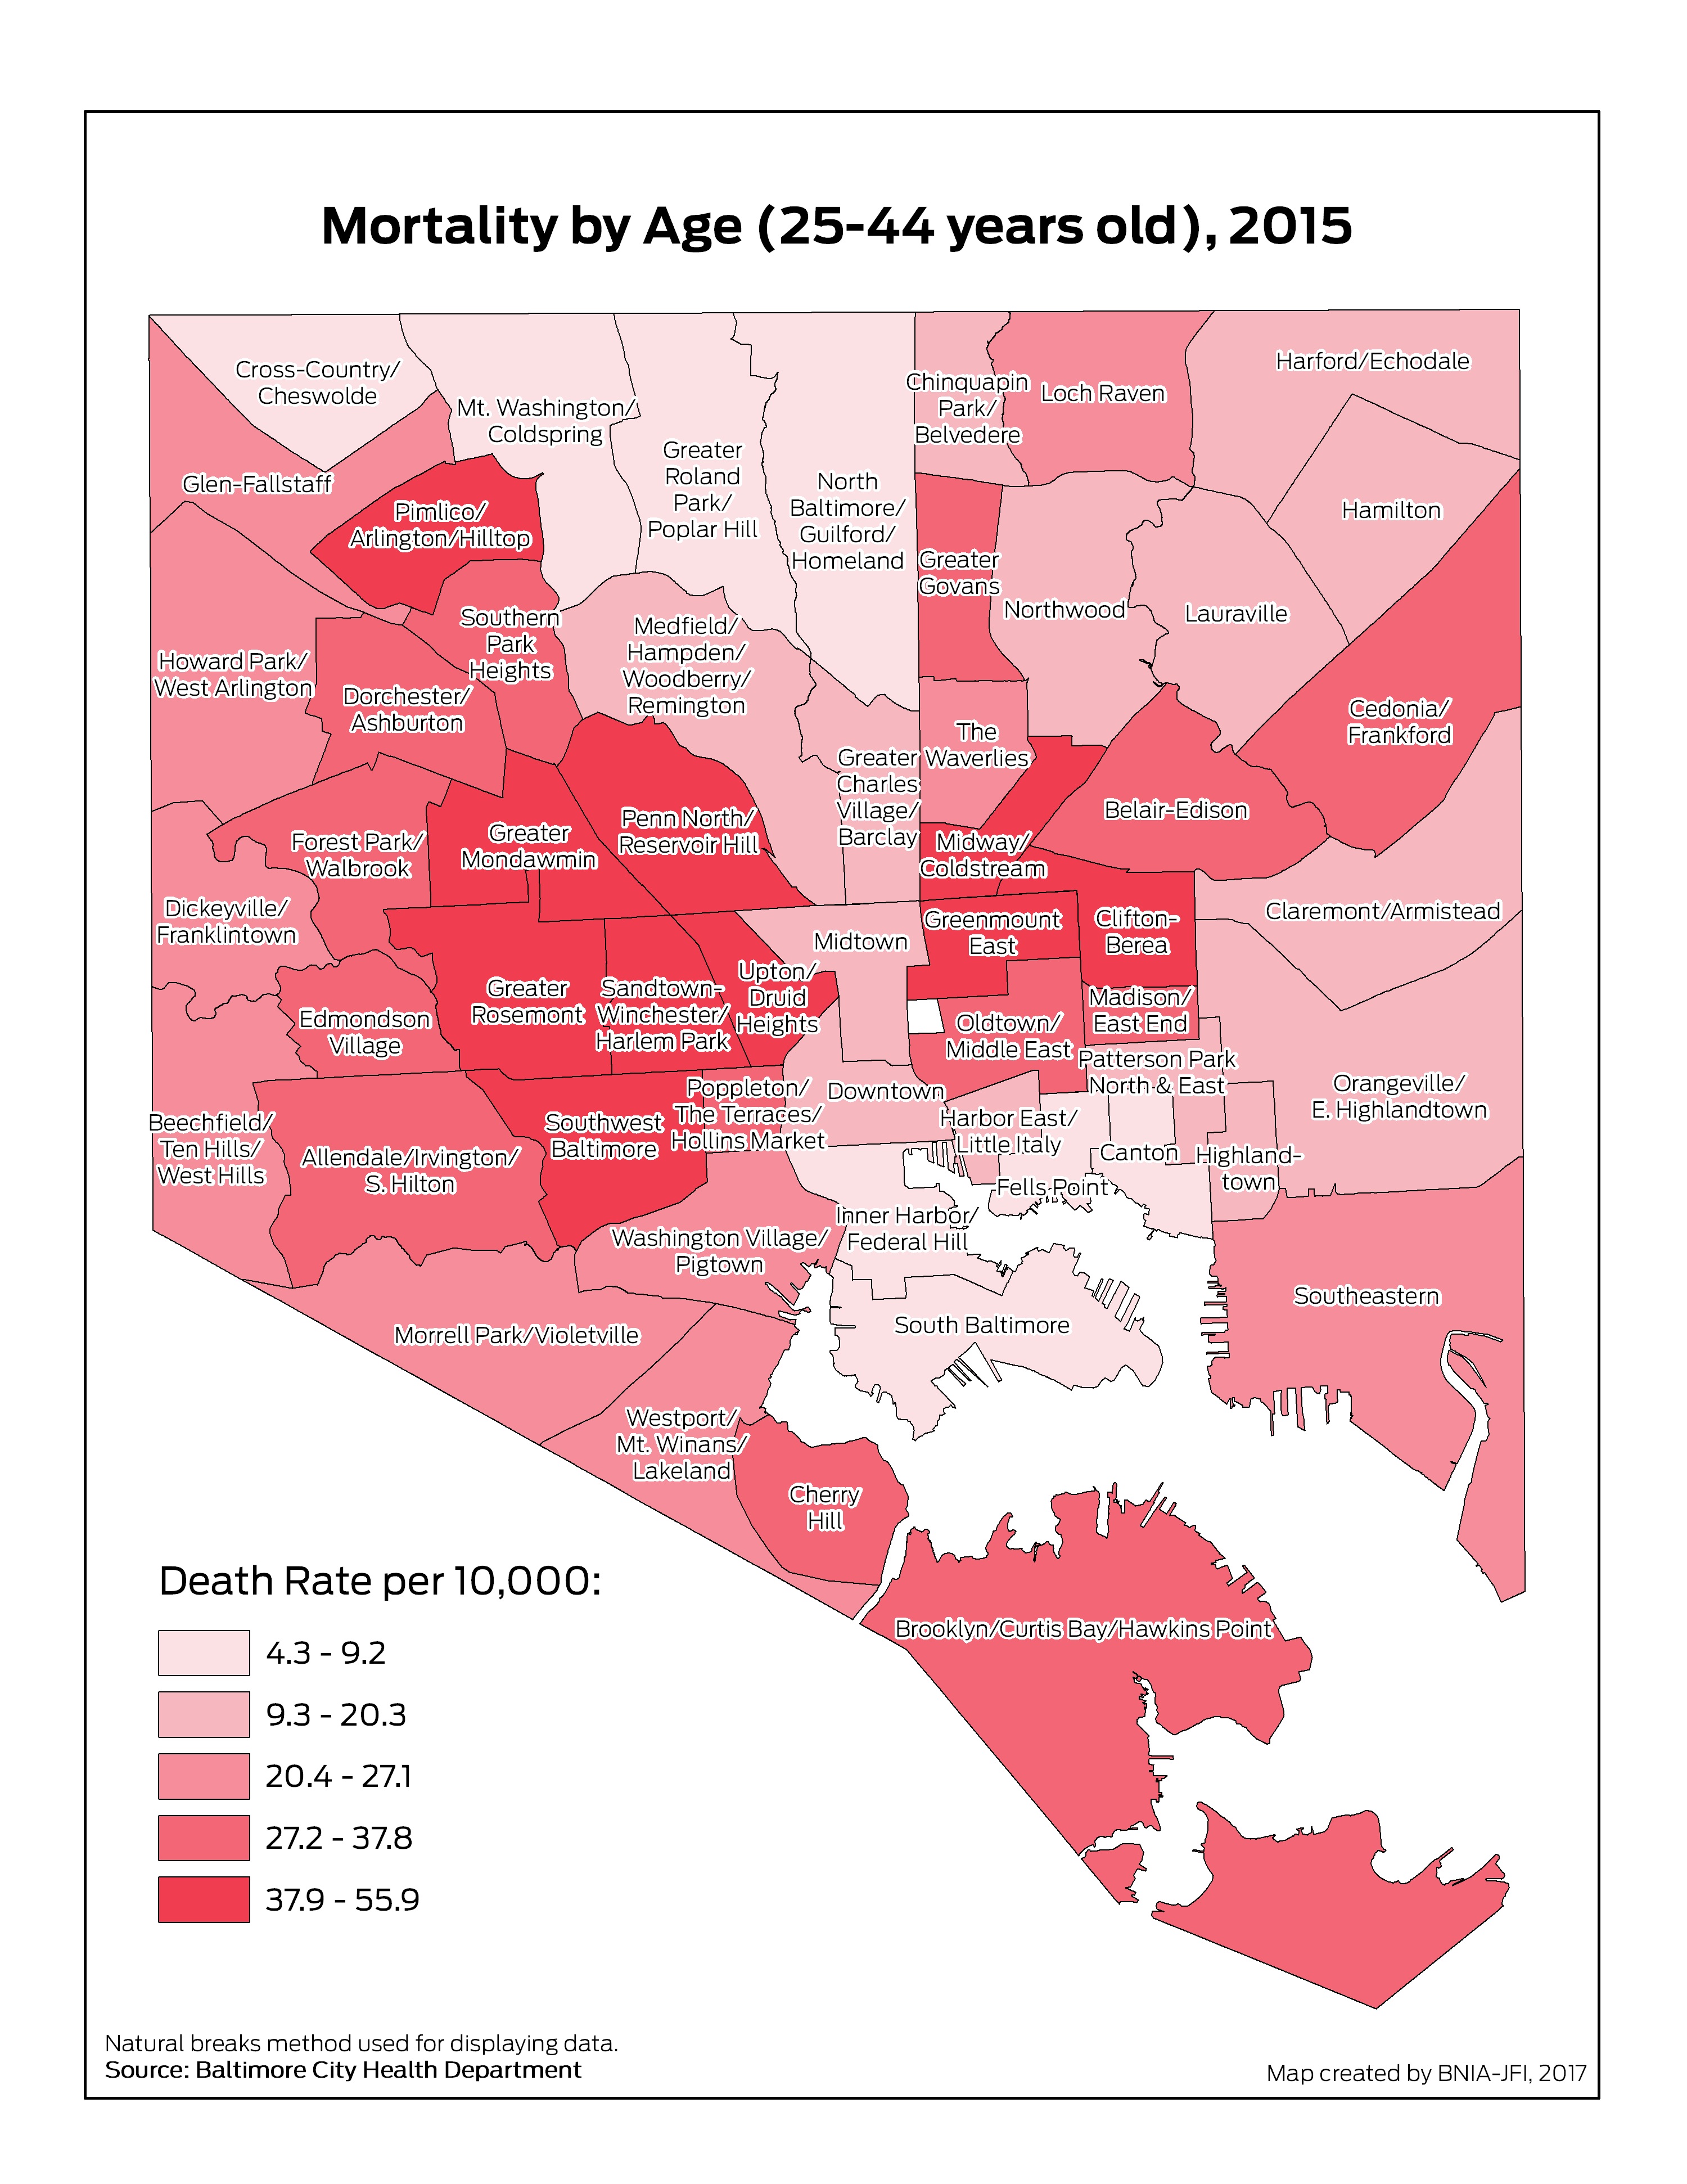
Mortality by Age (25-44 Years Old)
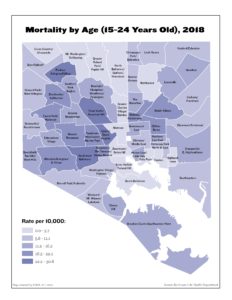
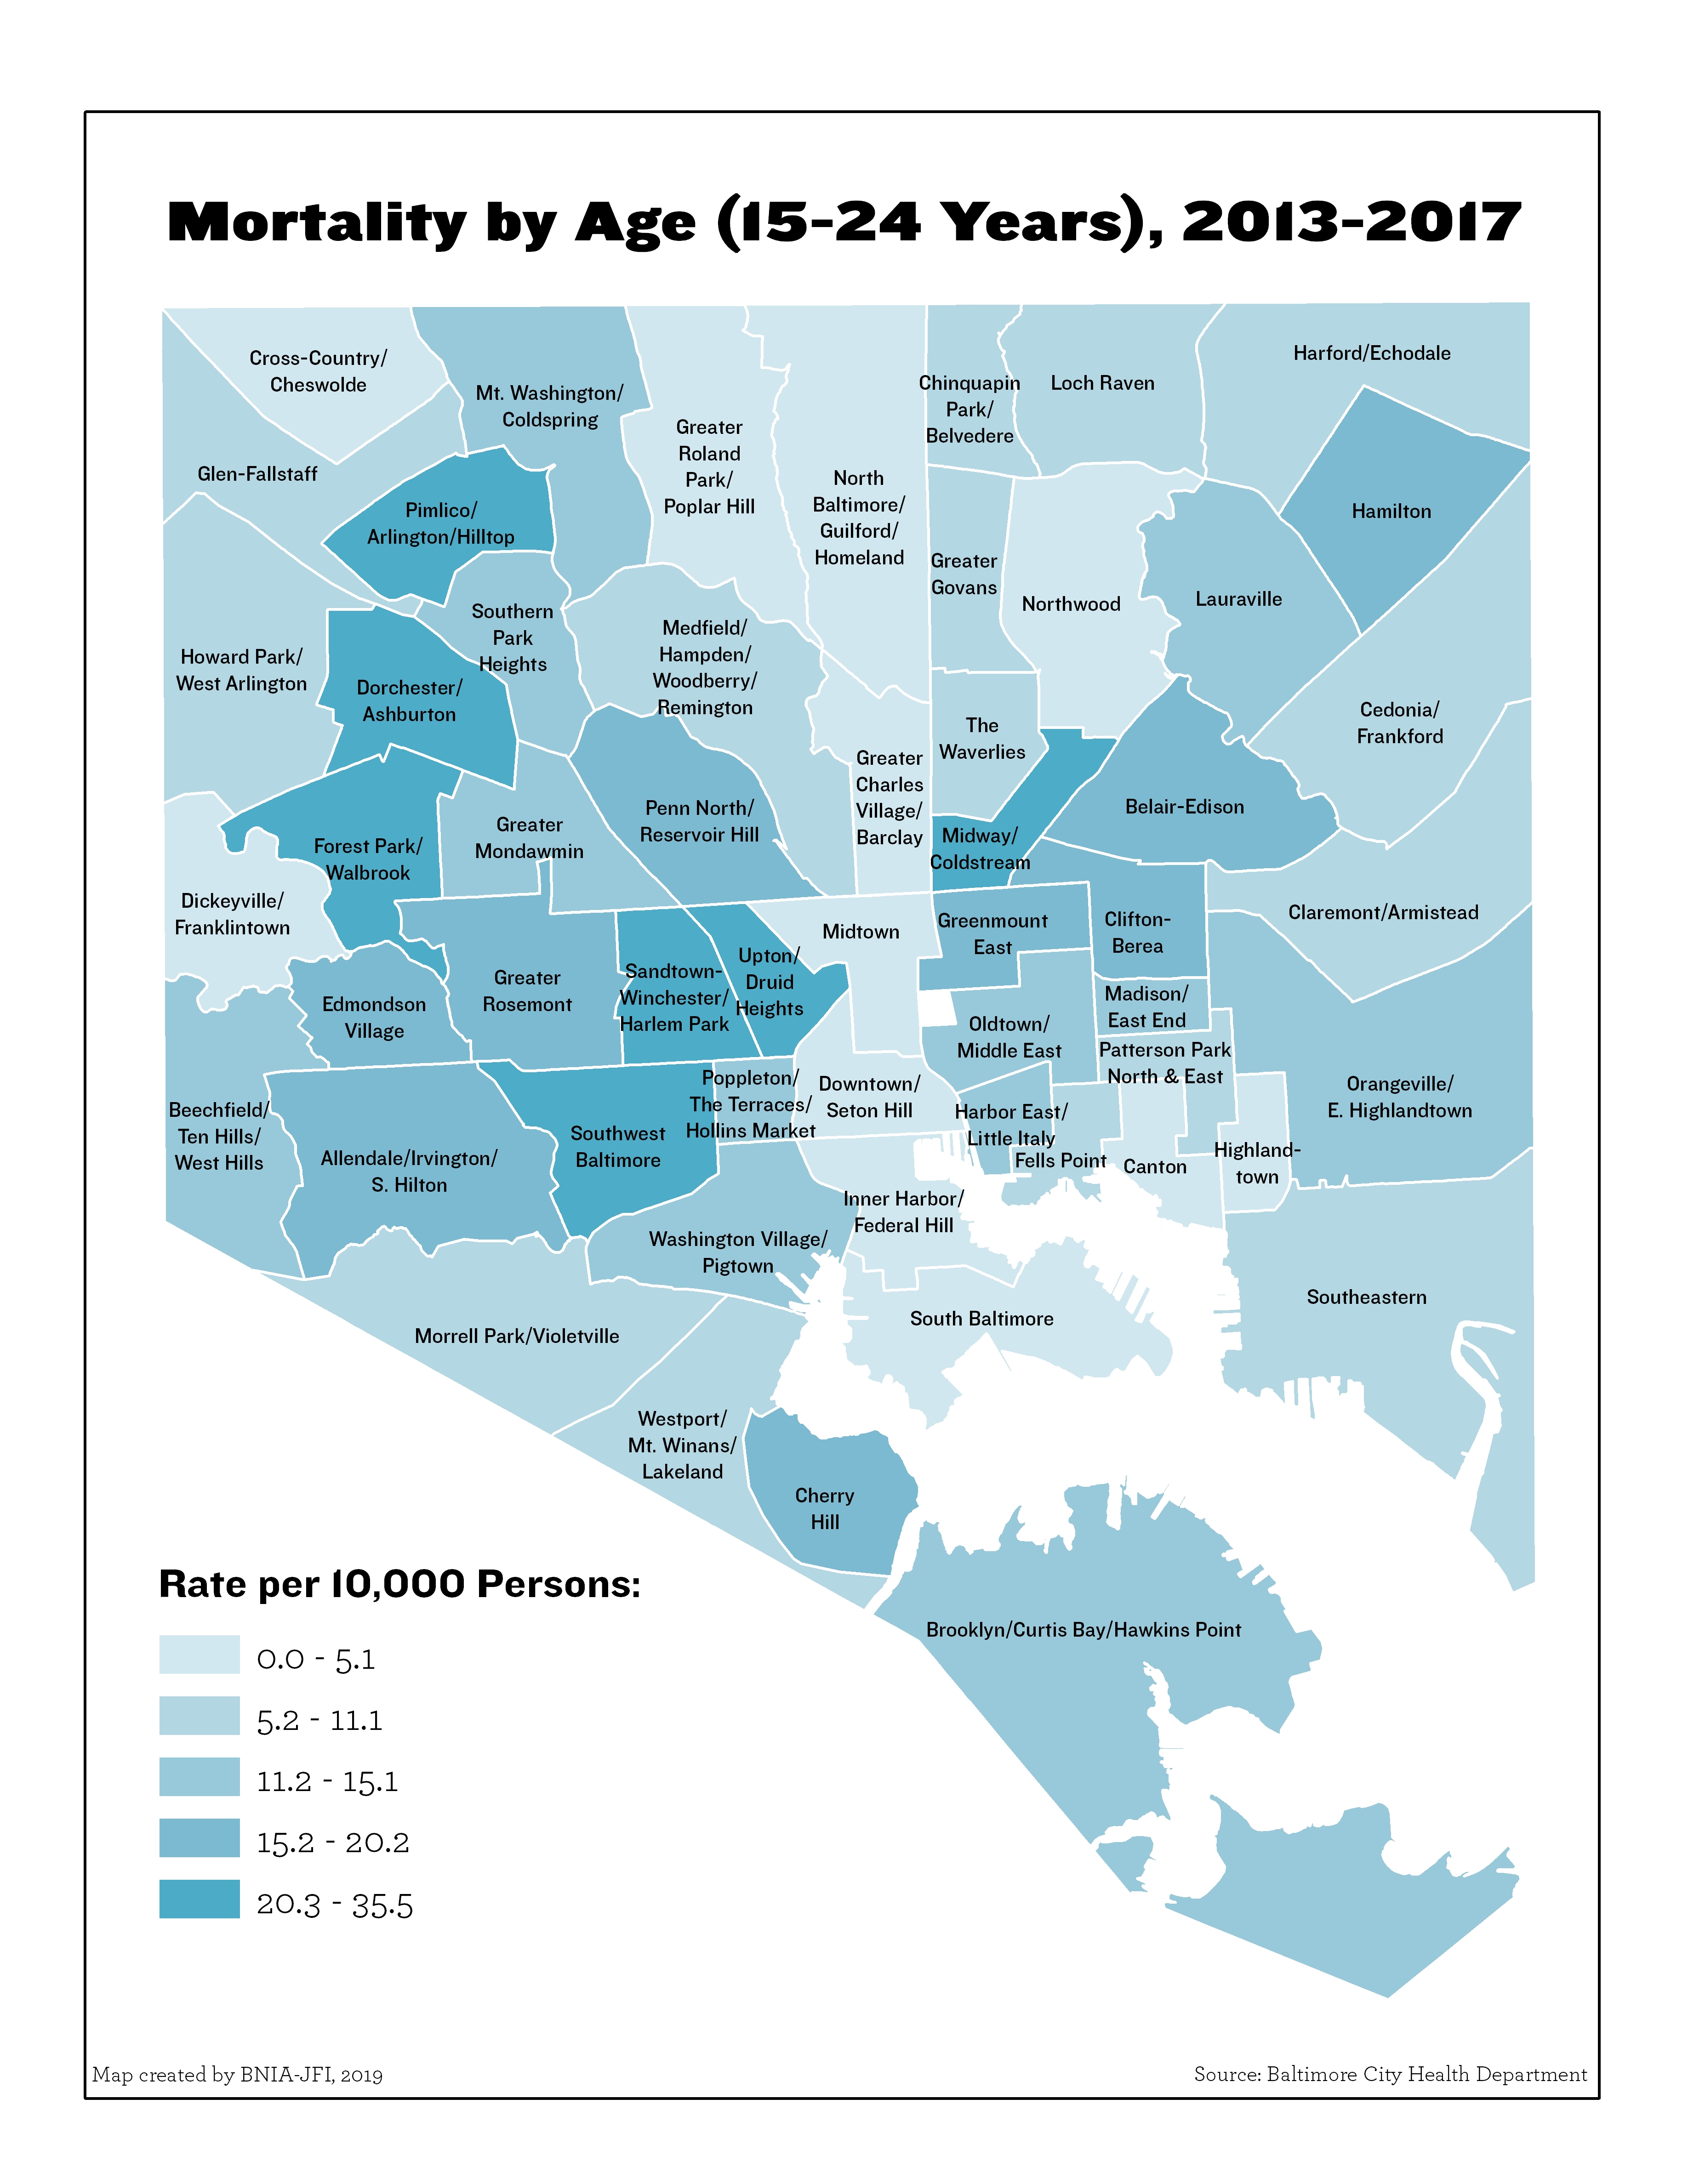
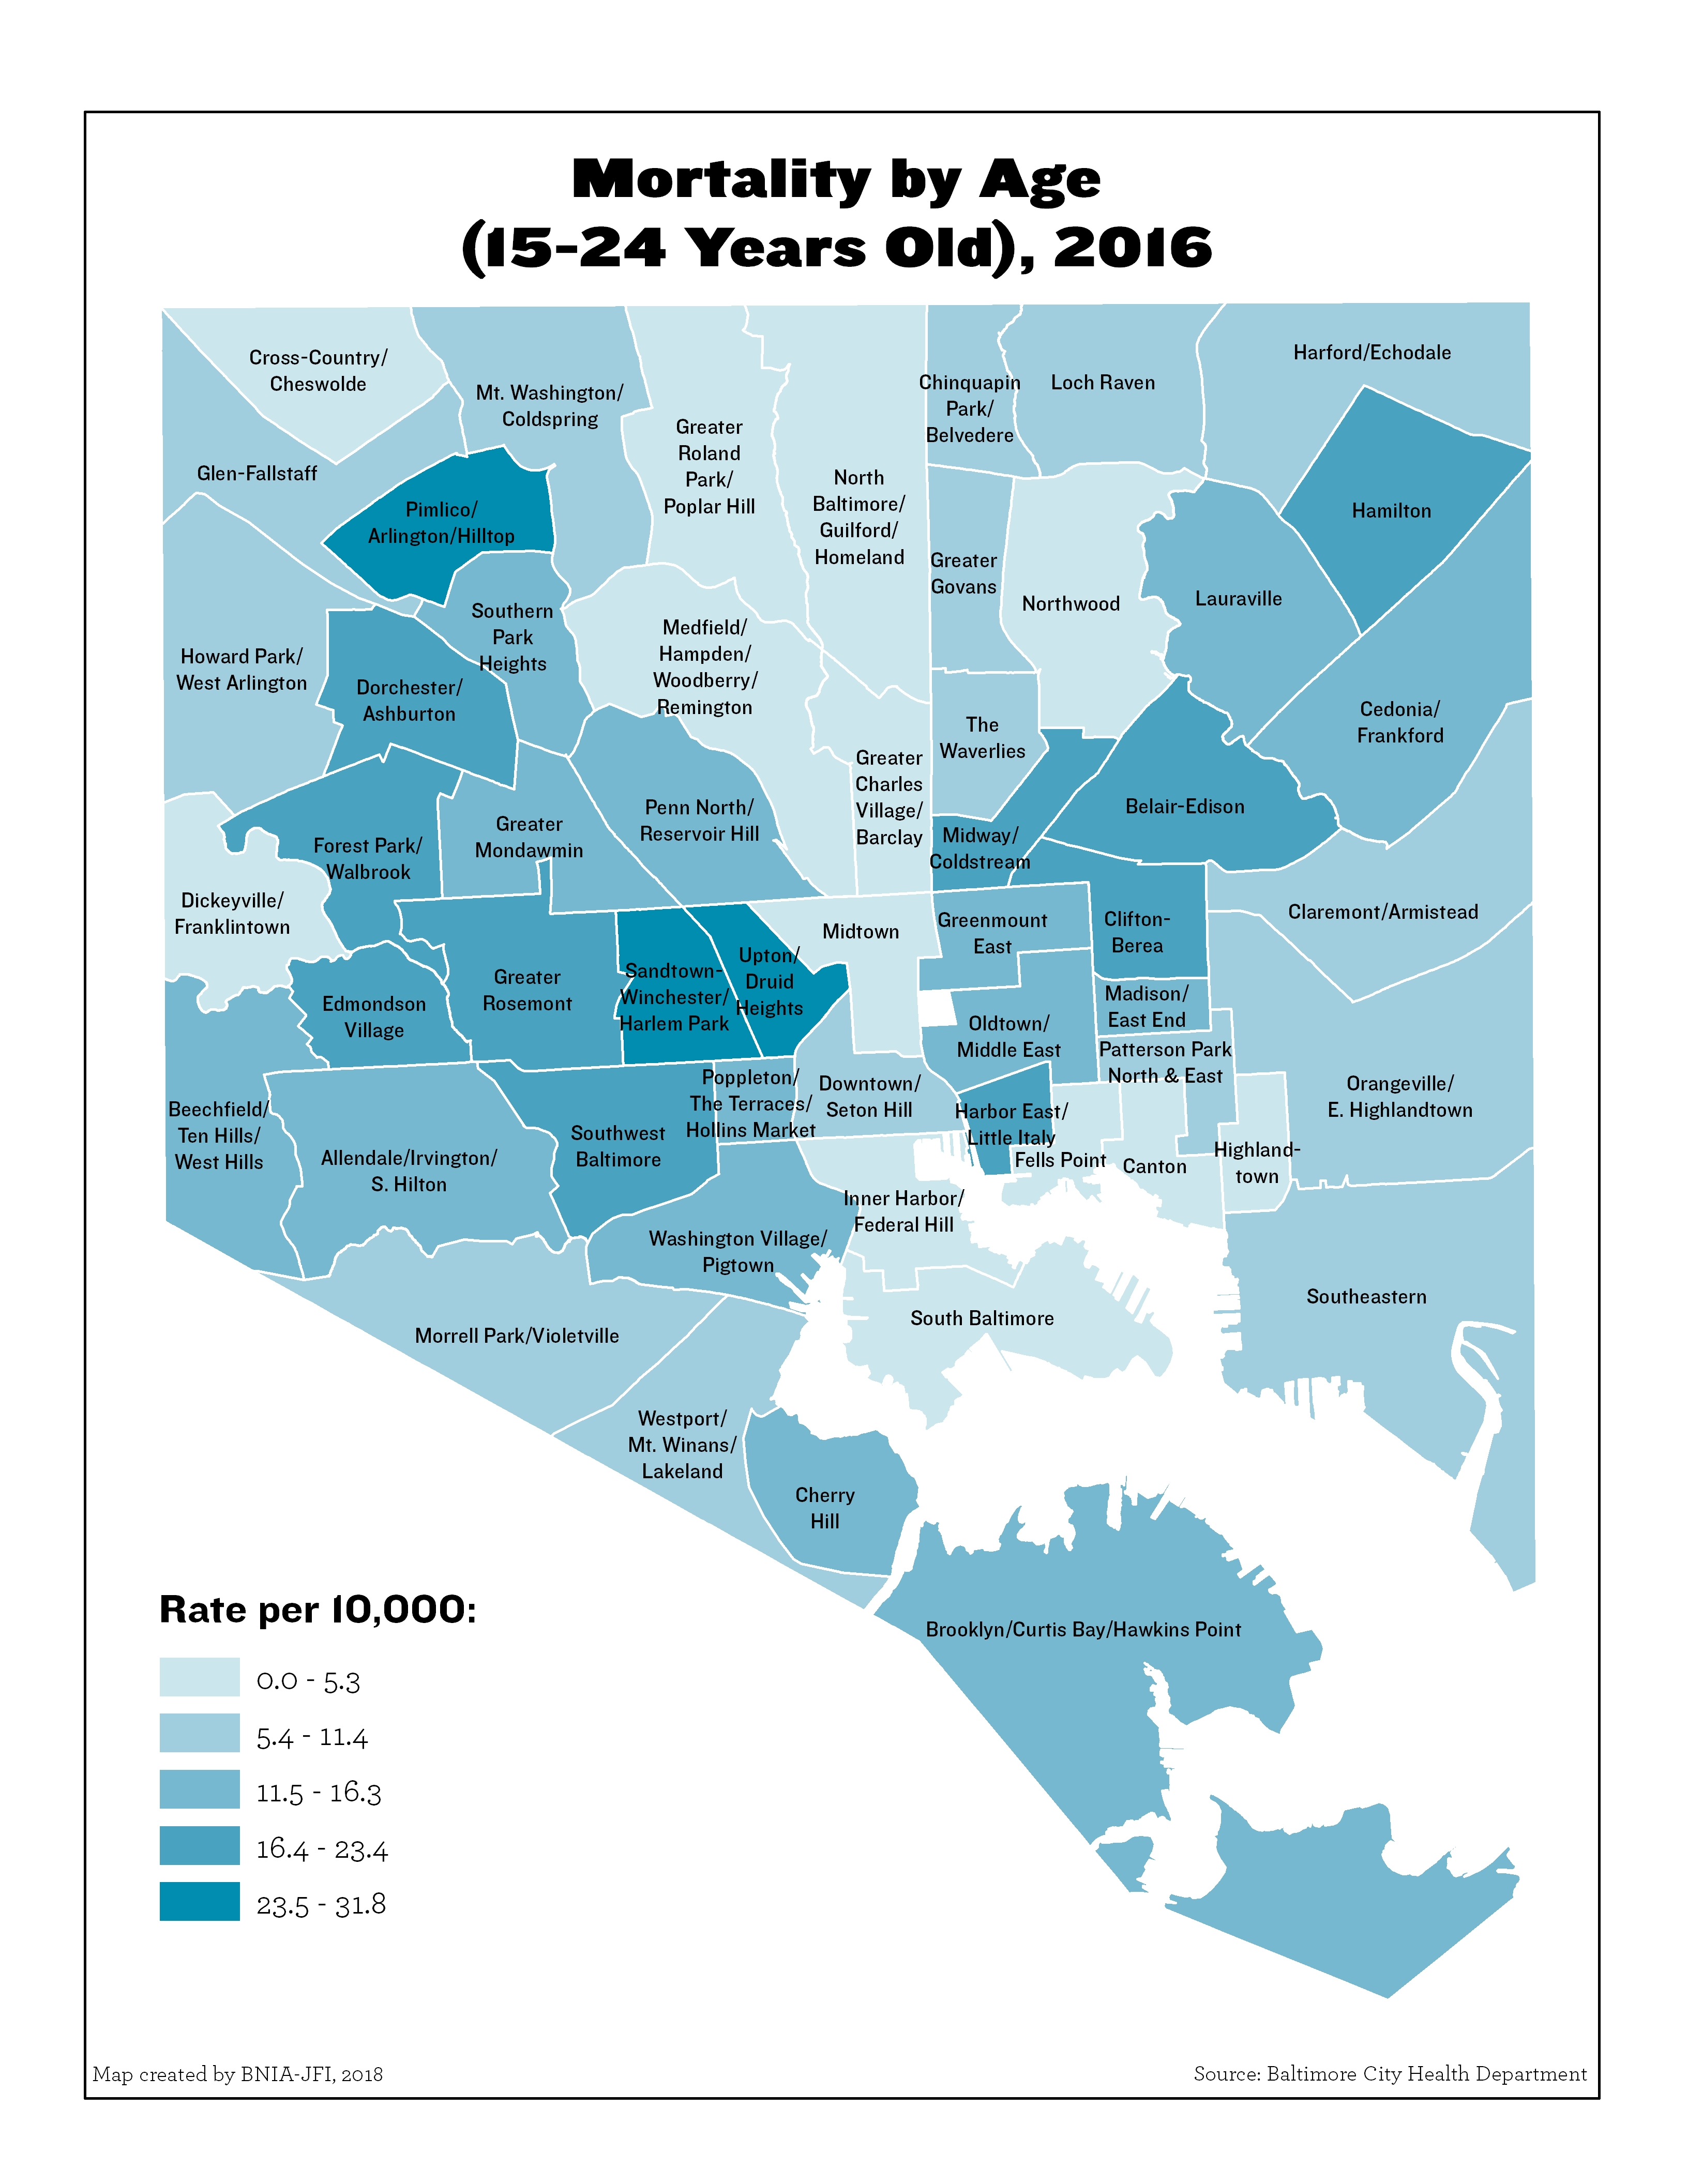
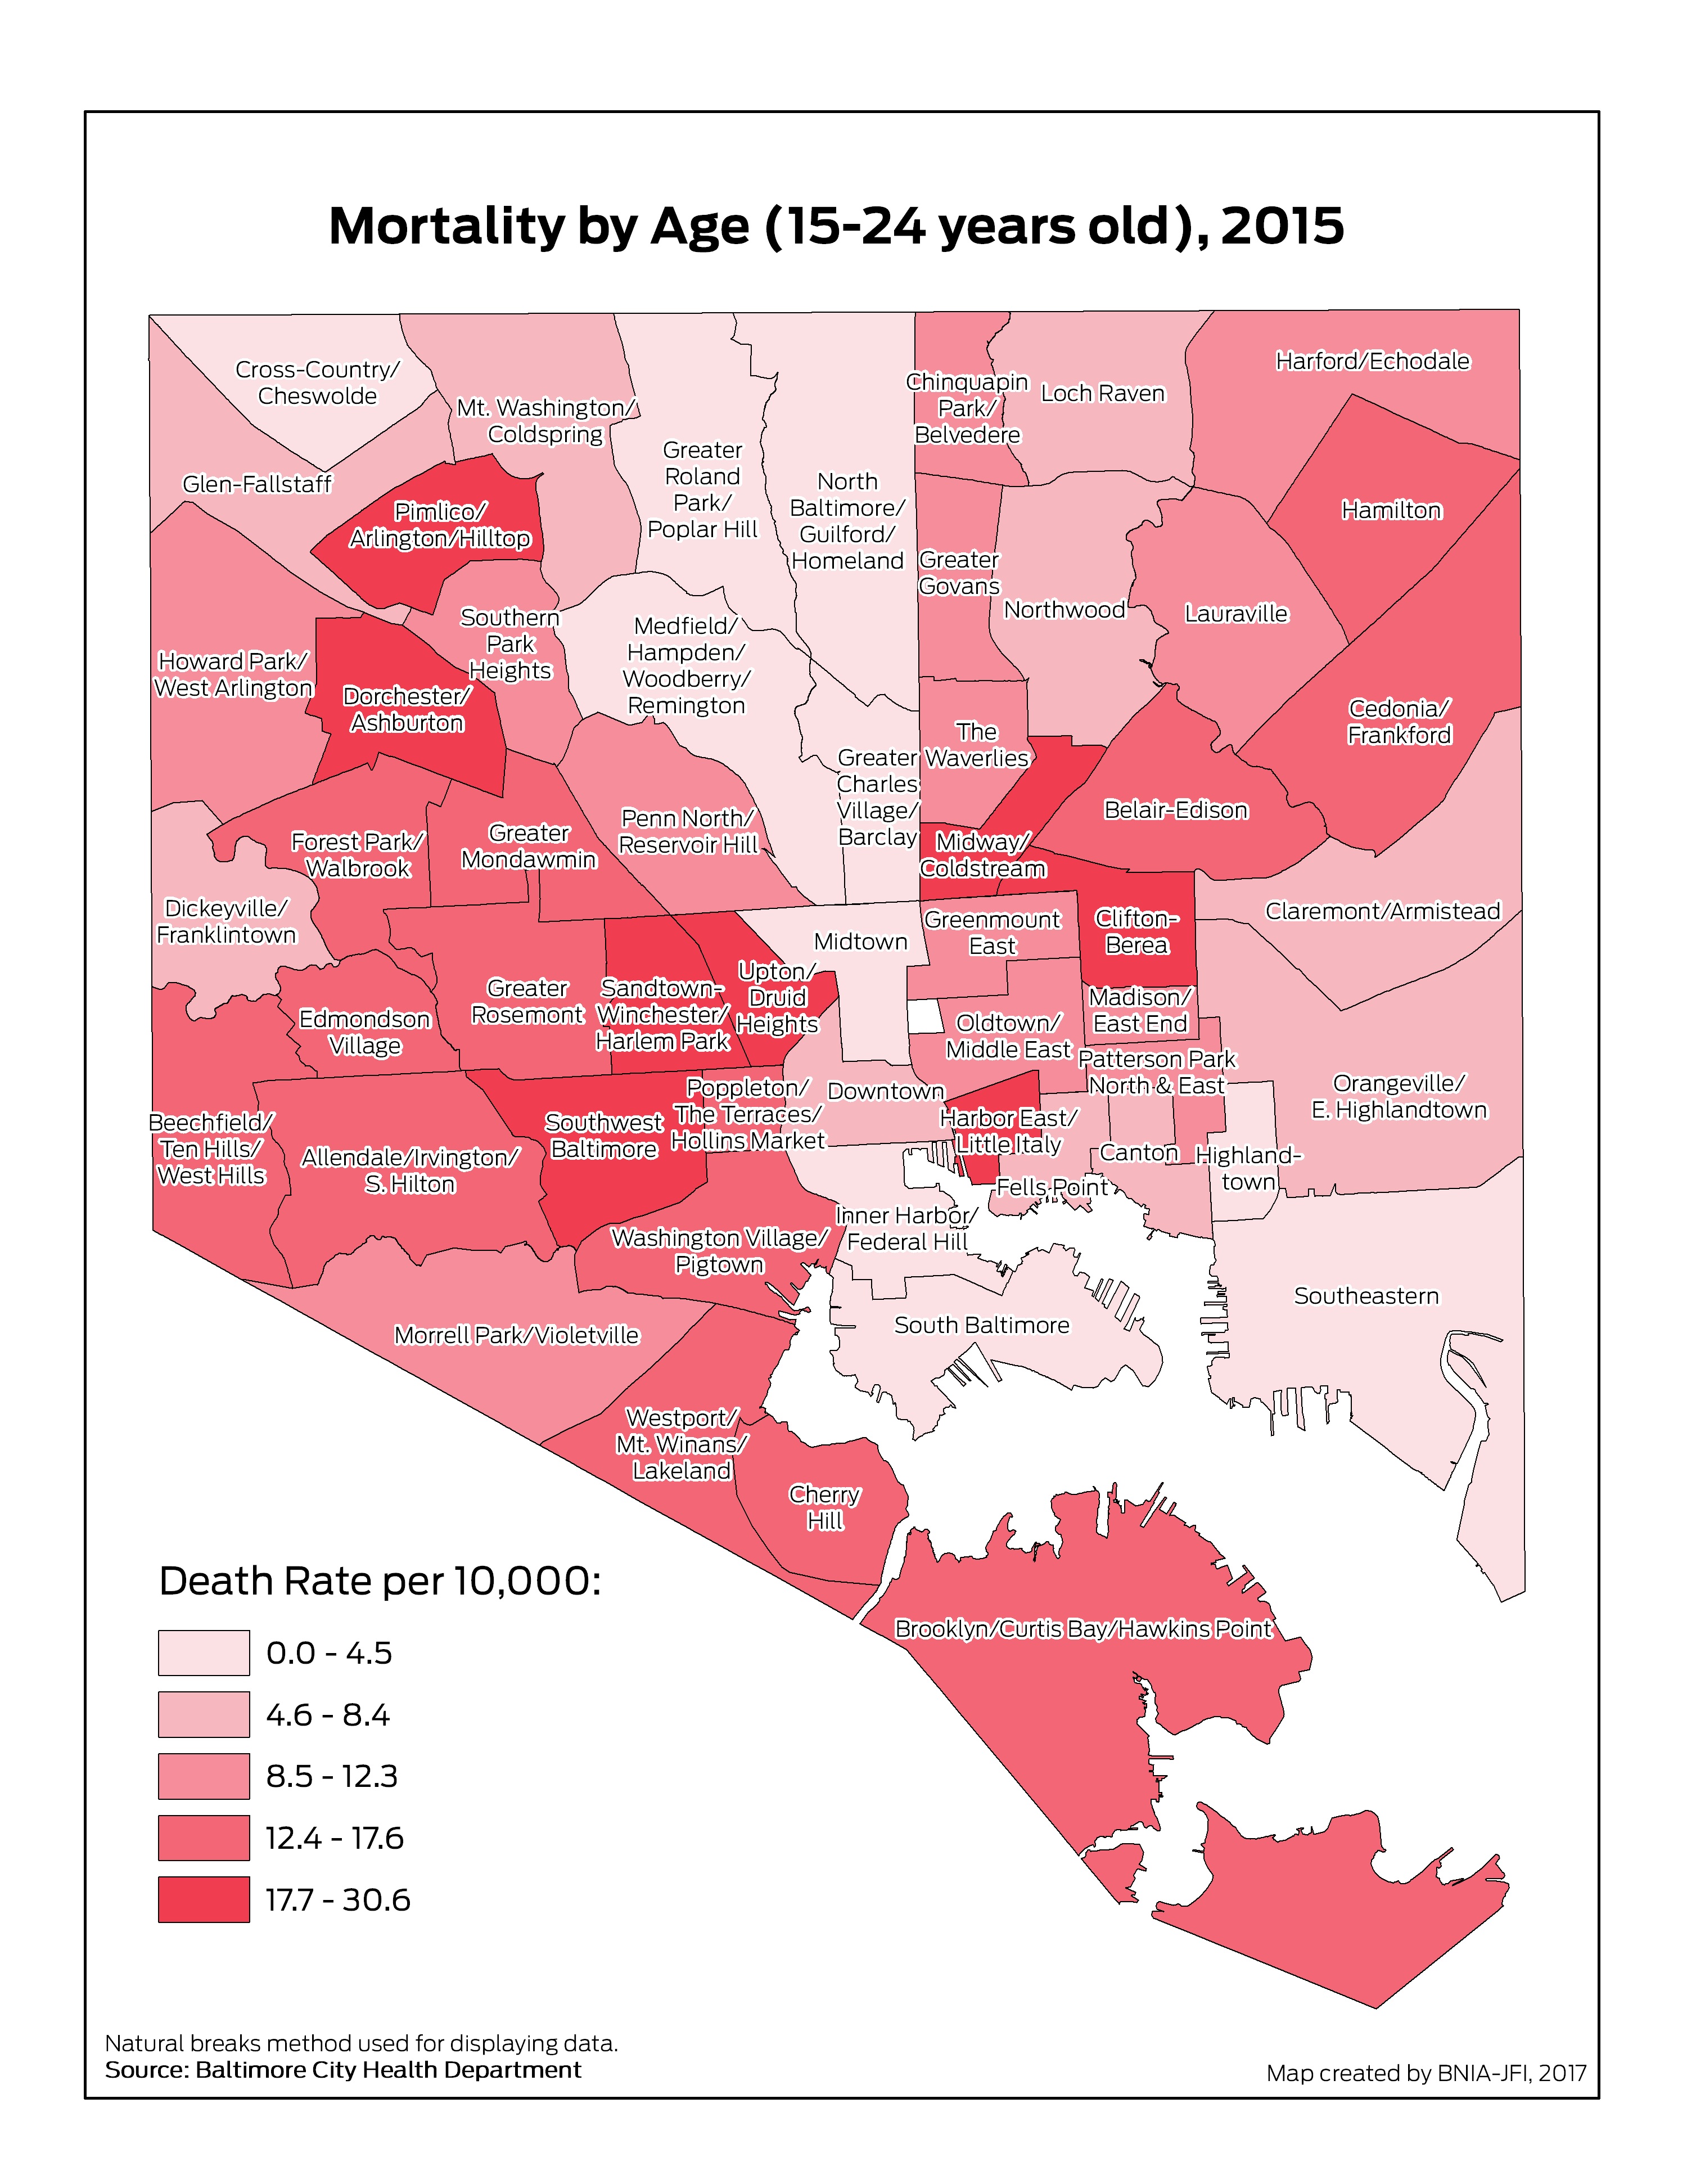
Mortality by Age (15-24 Years Old)
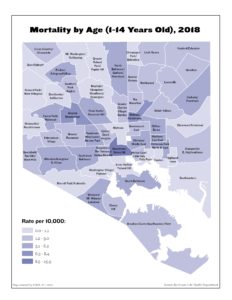
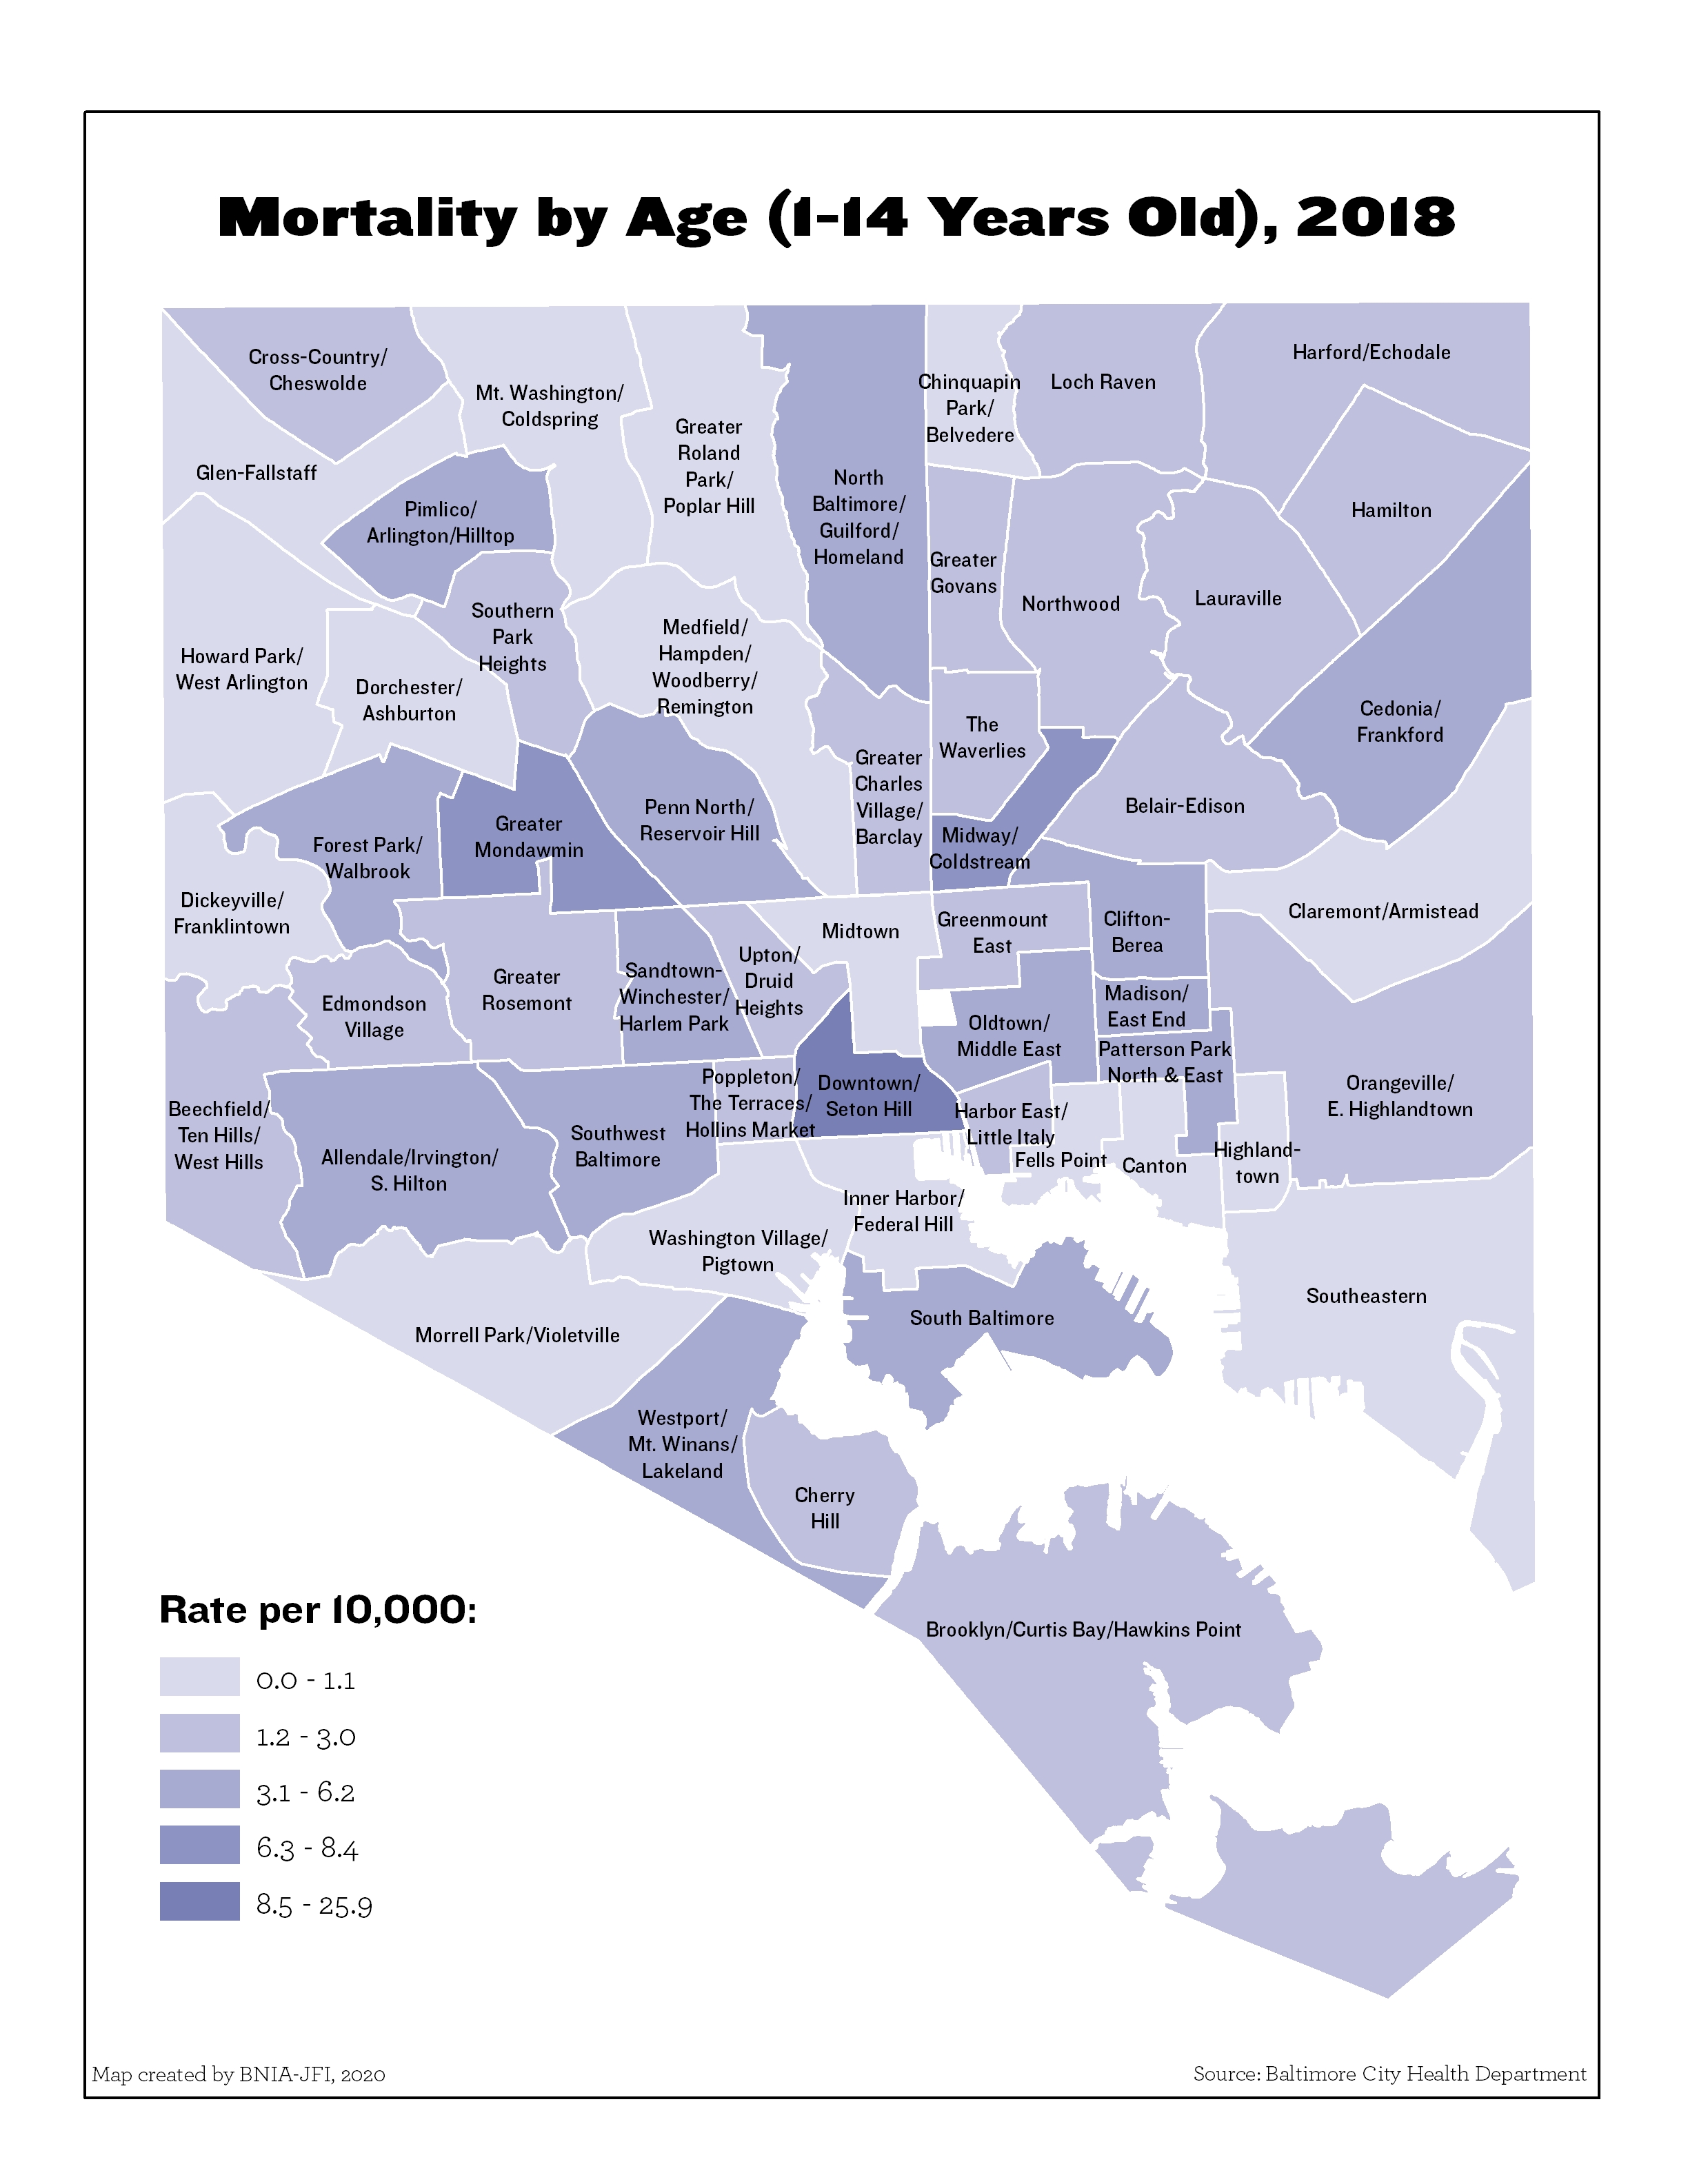
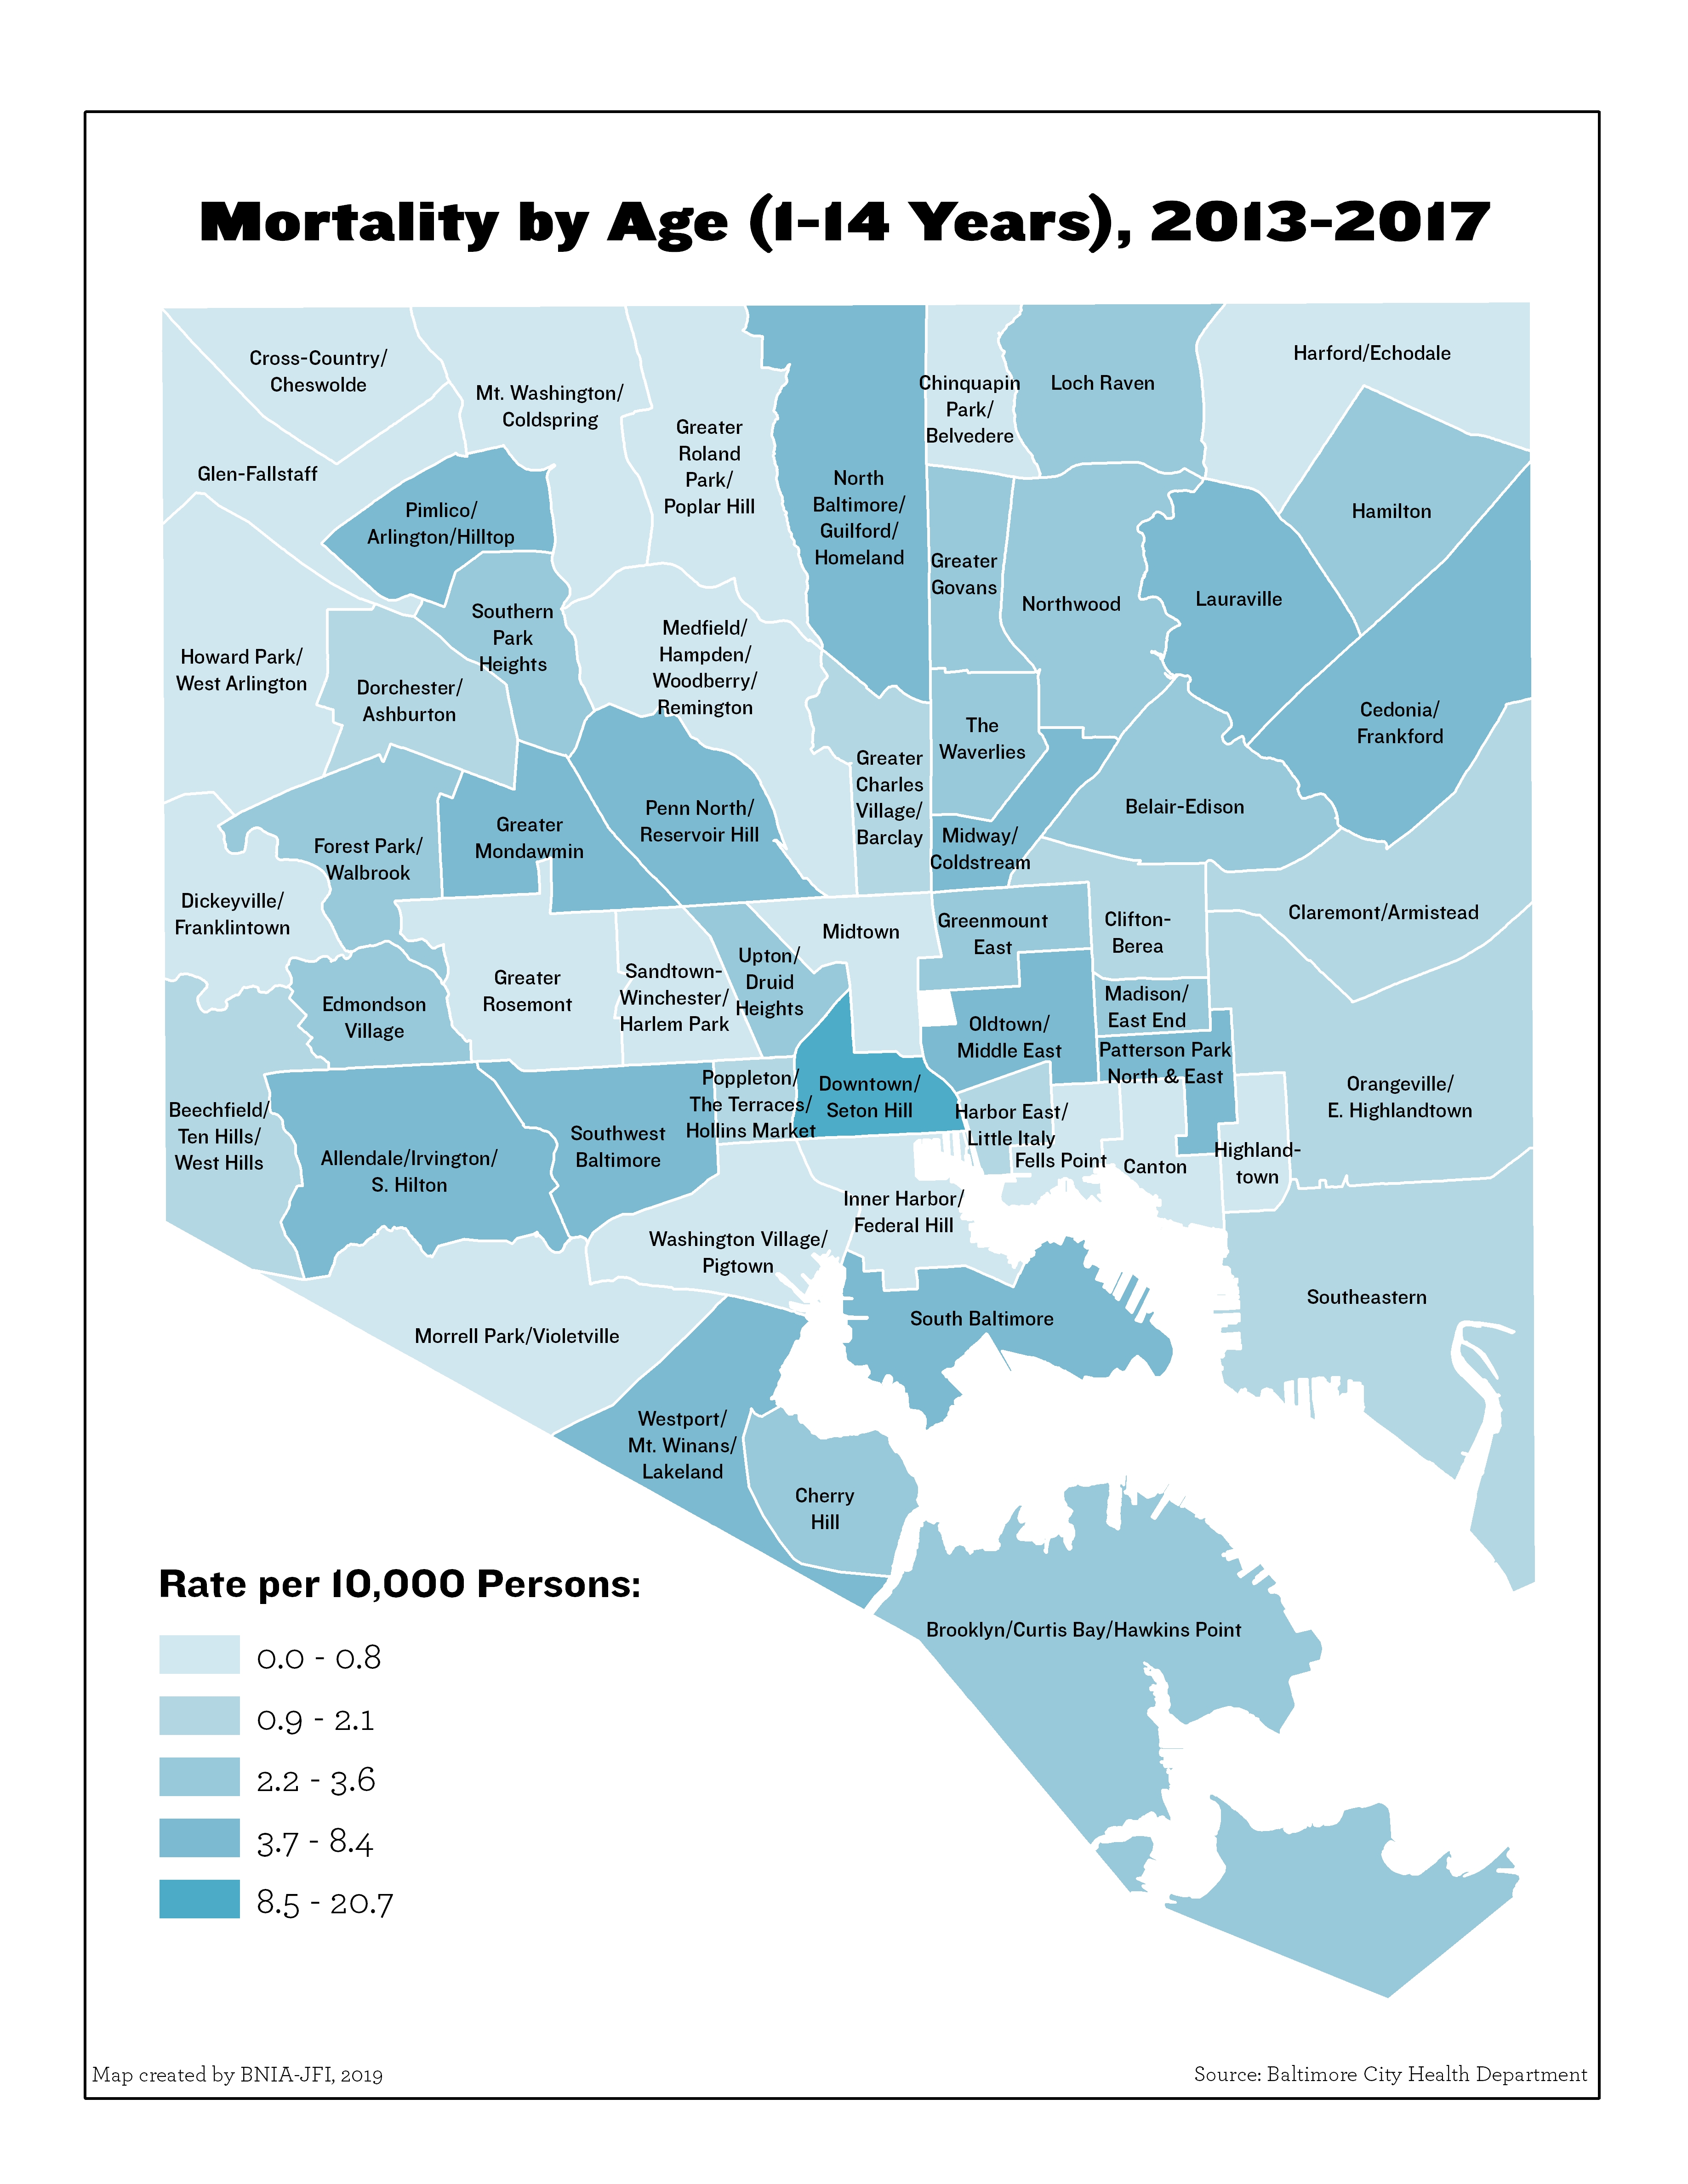
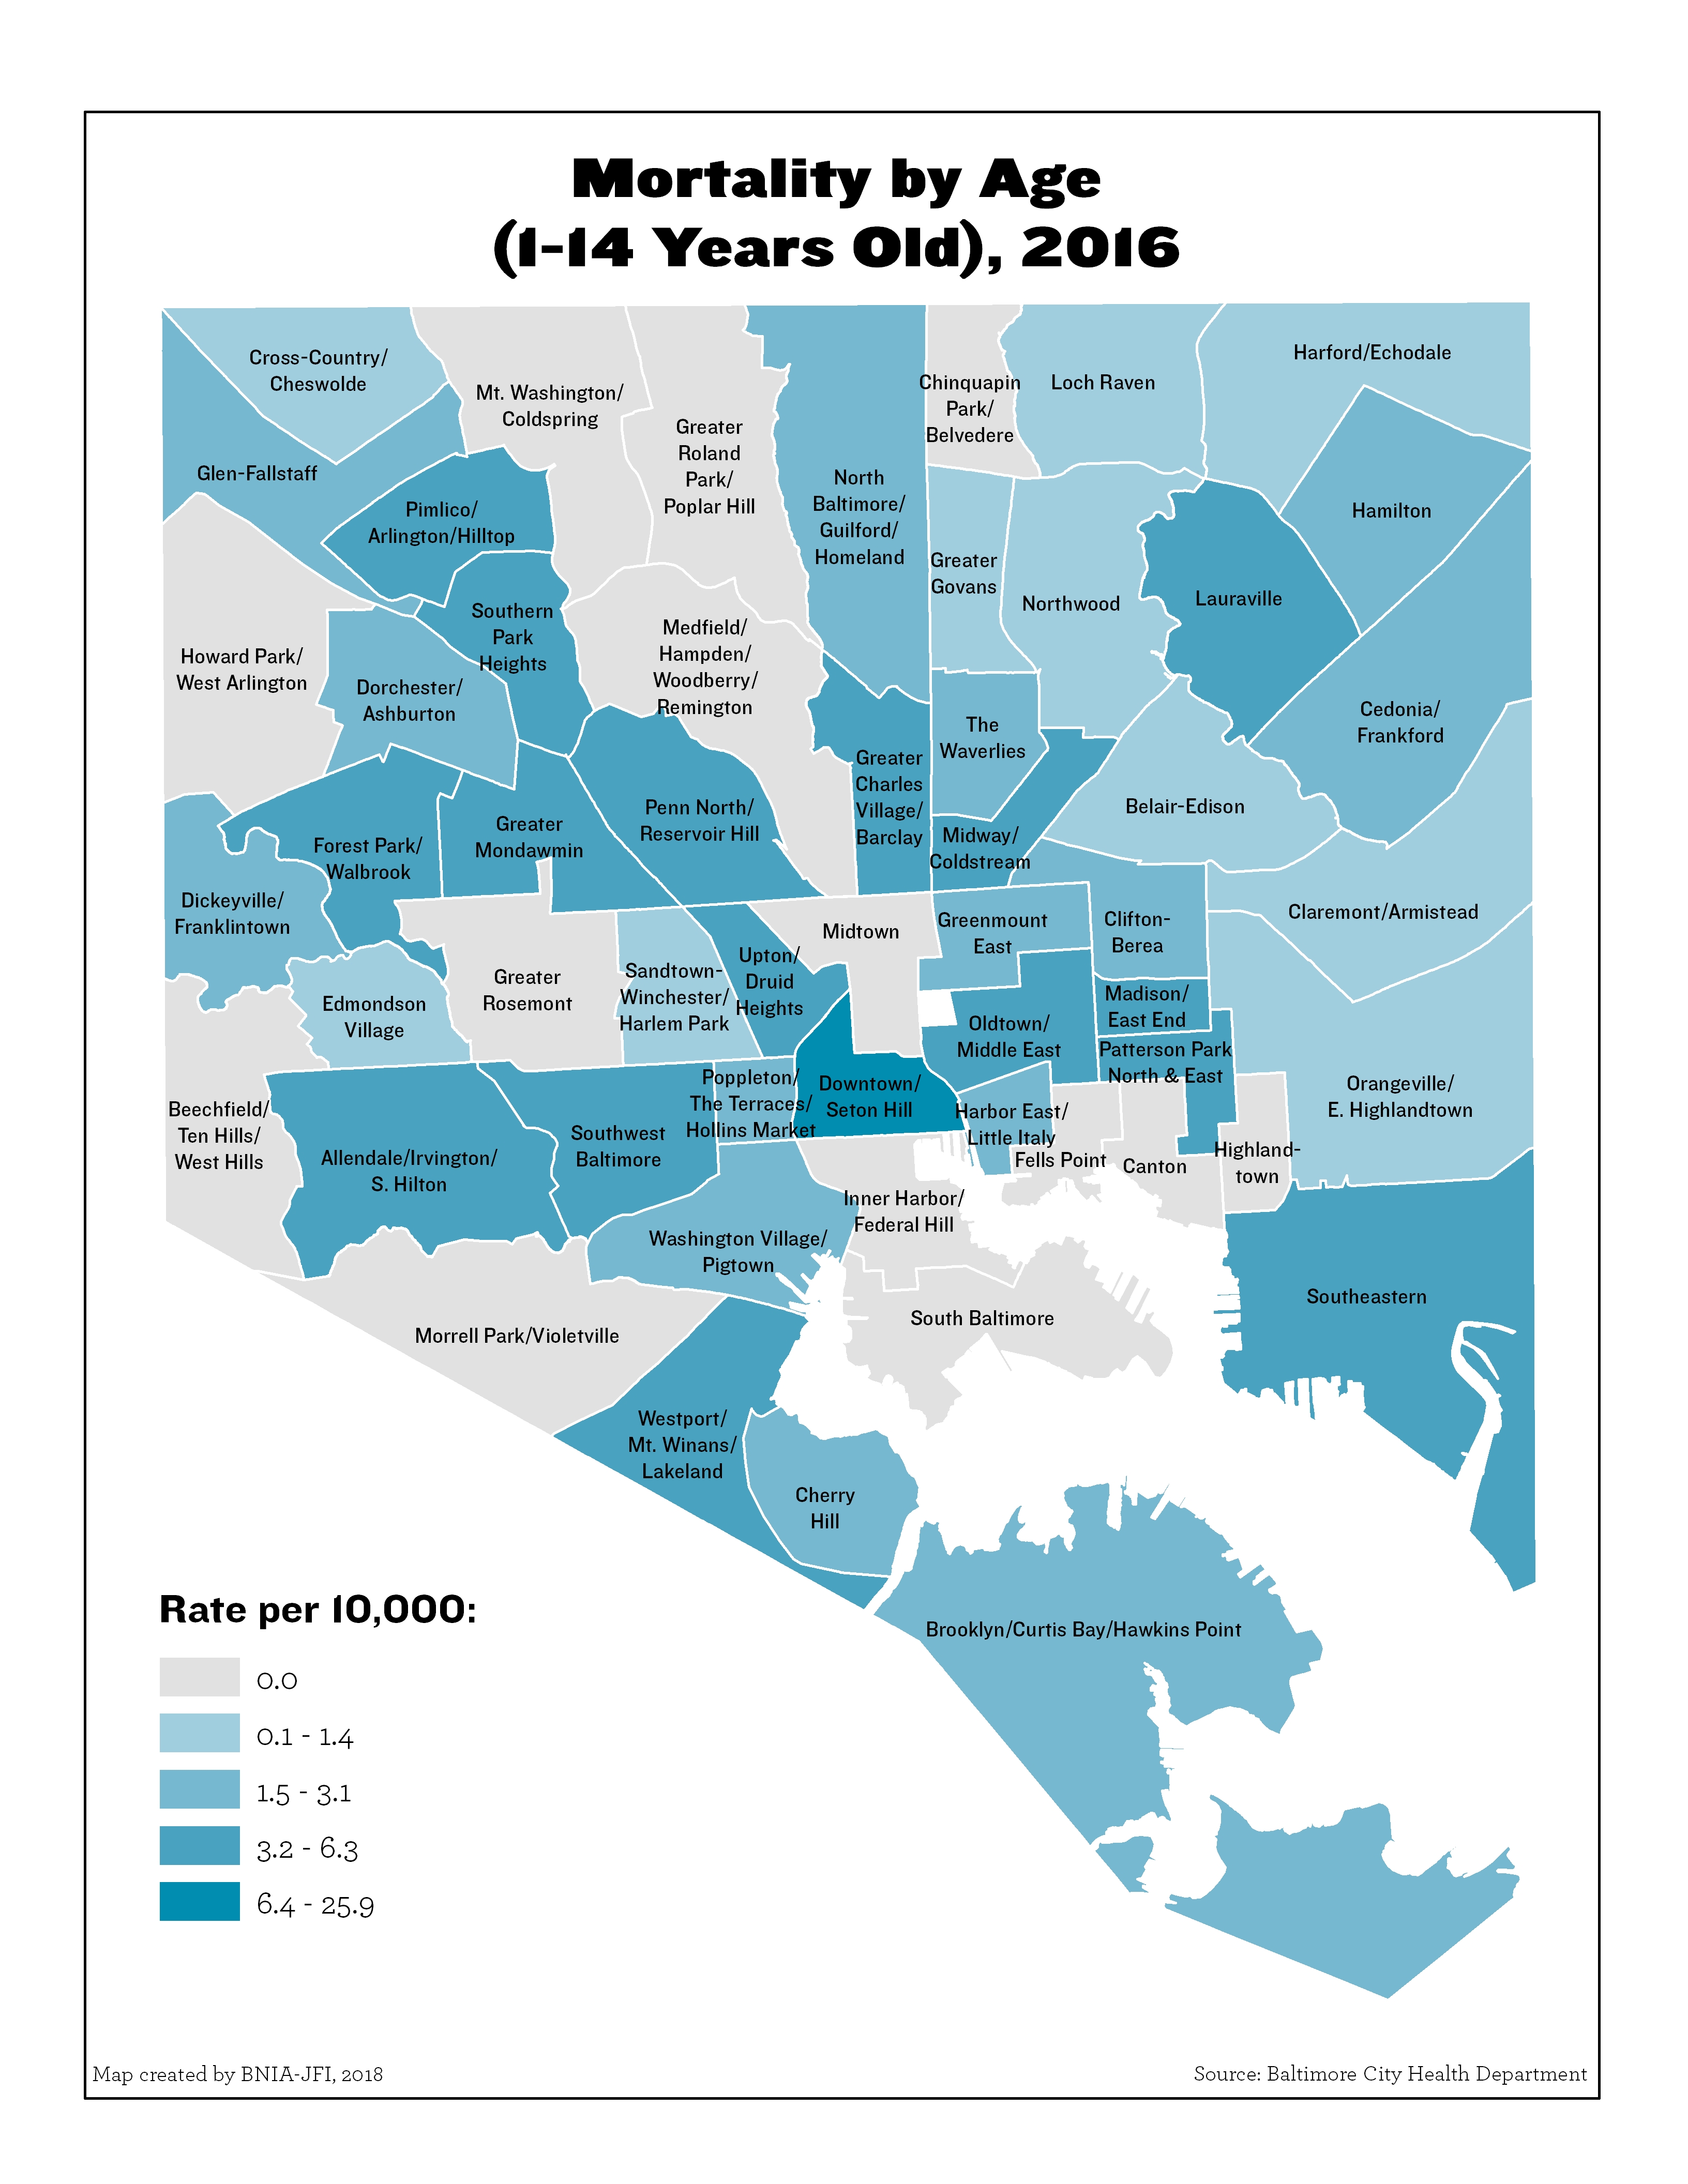
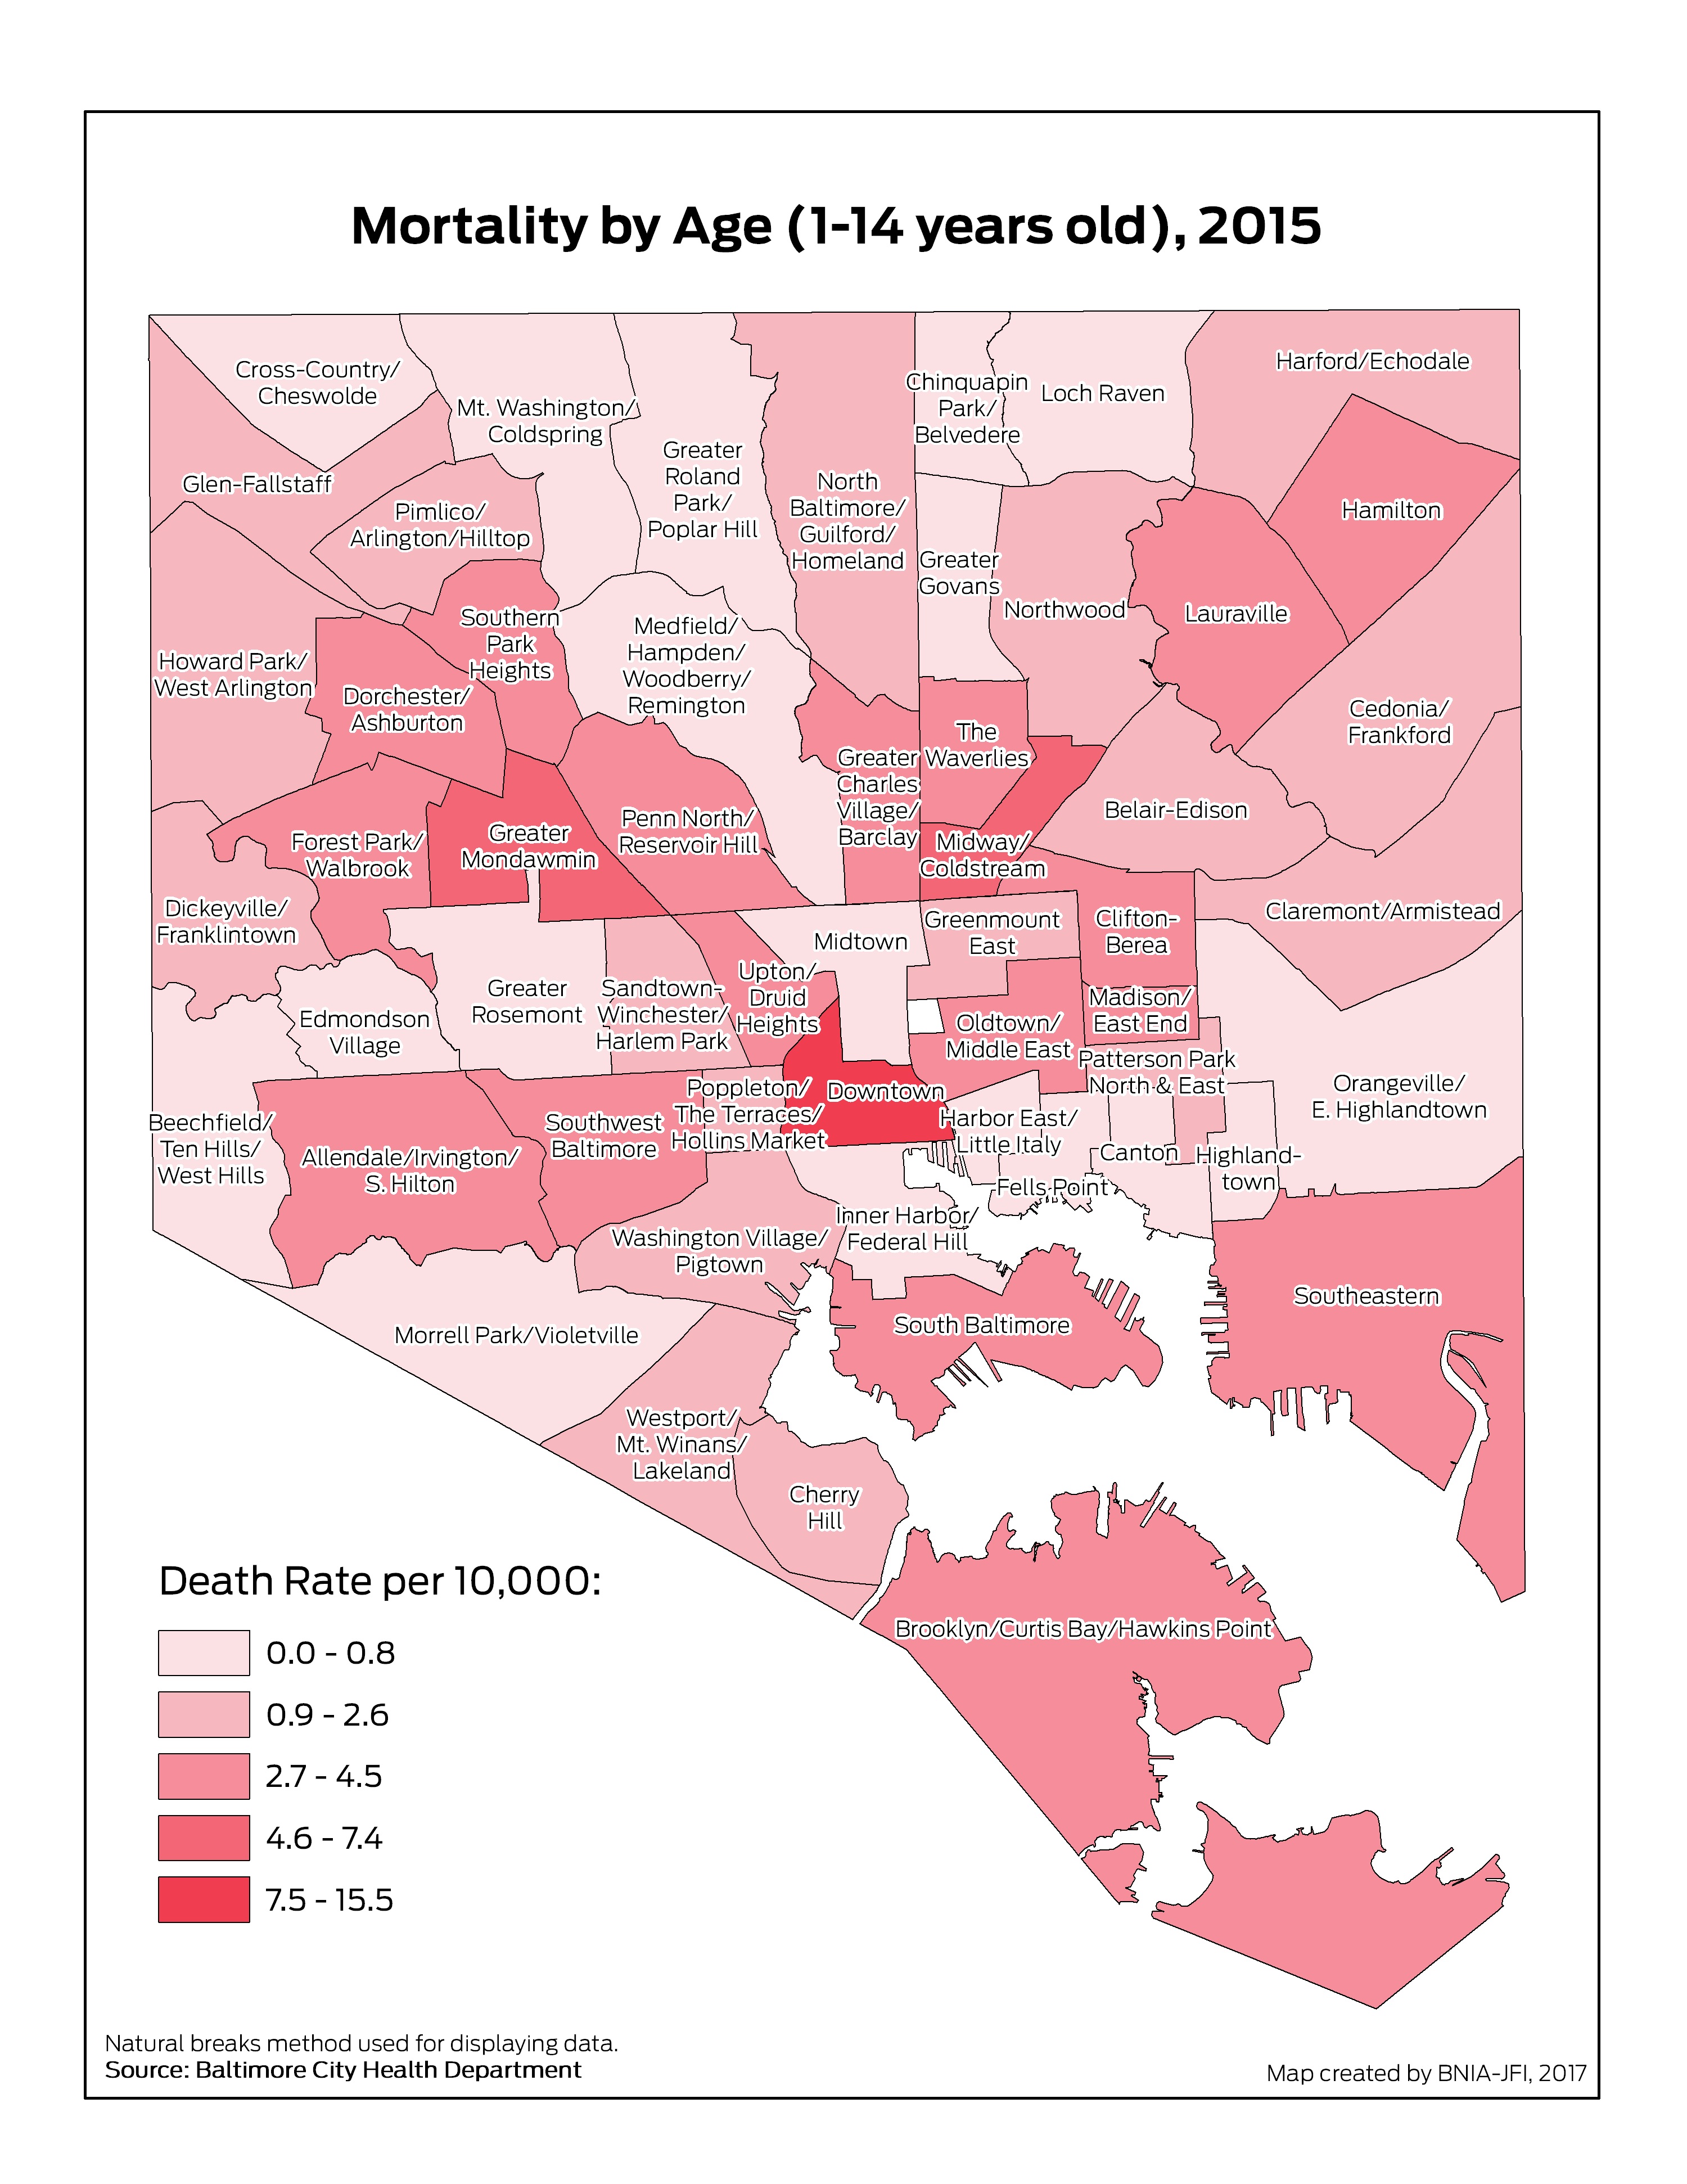
Mortality by Age (1-14 Years Old)

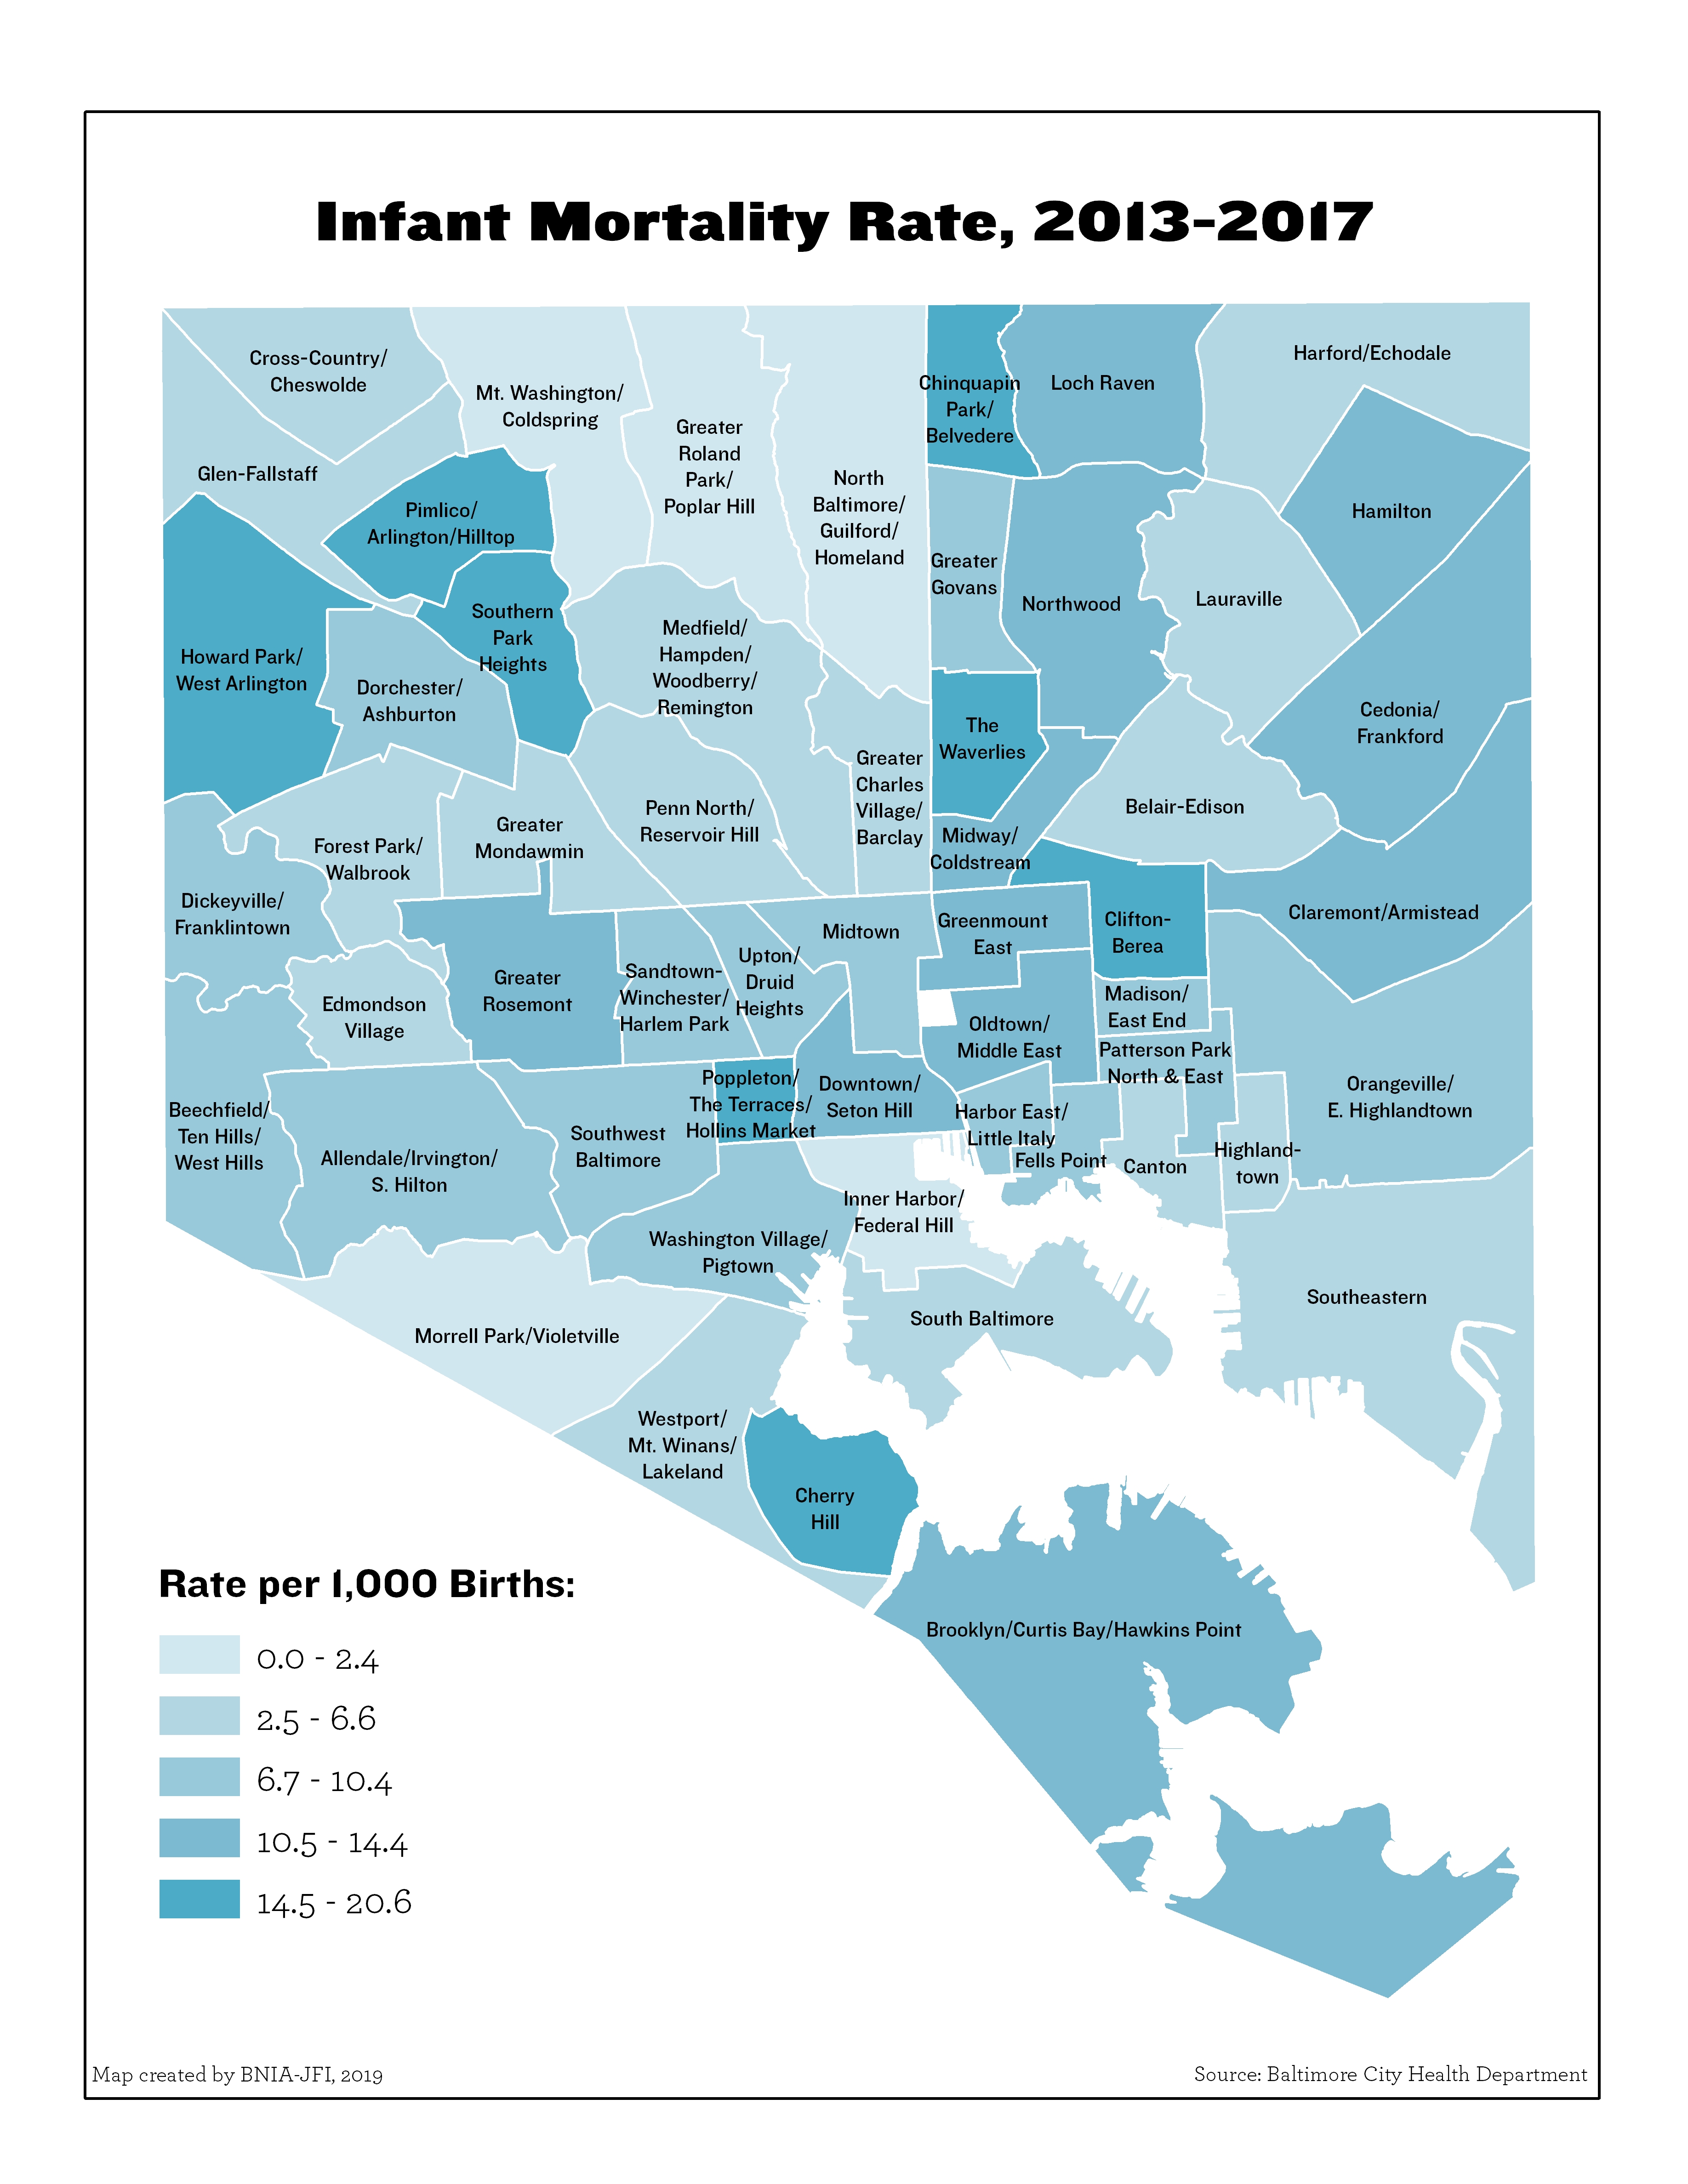
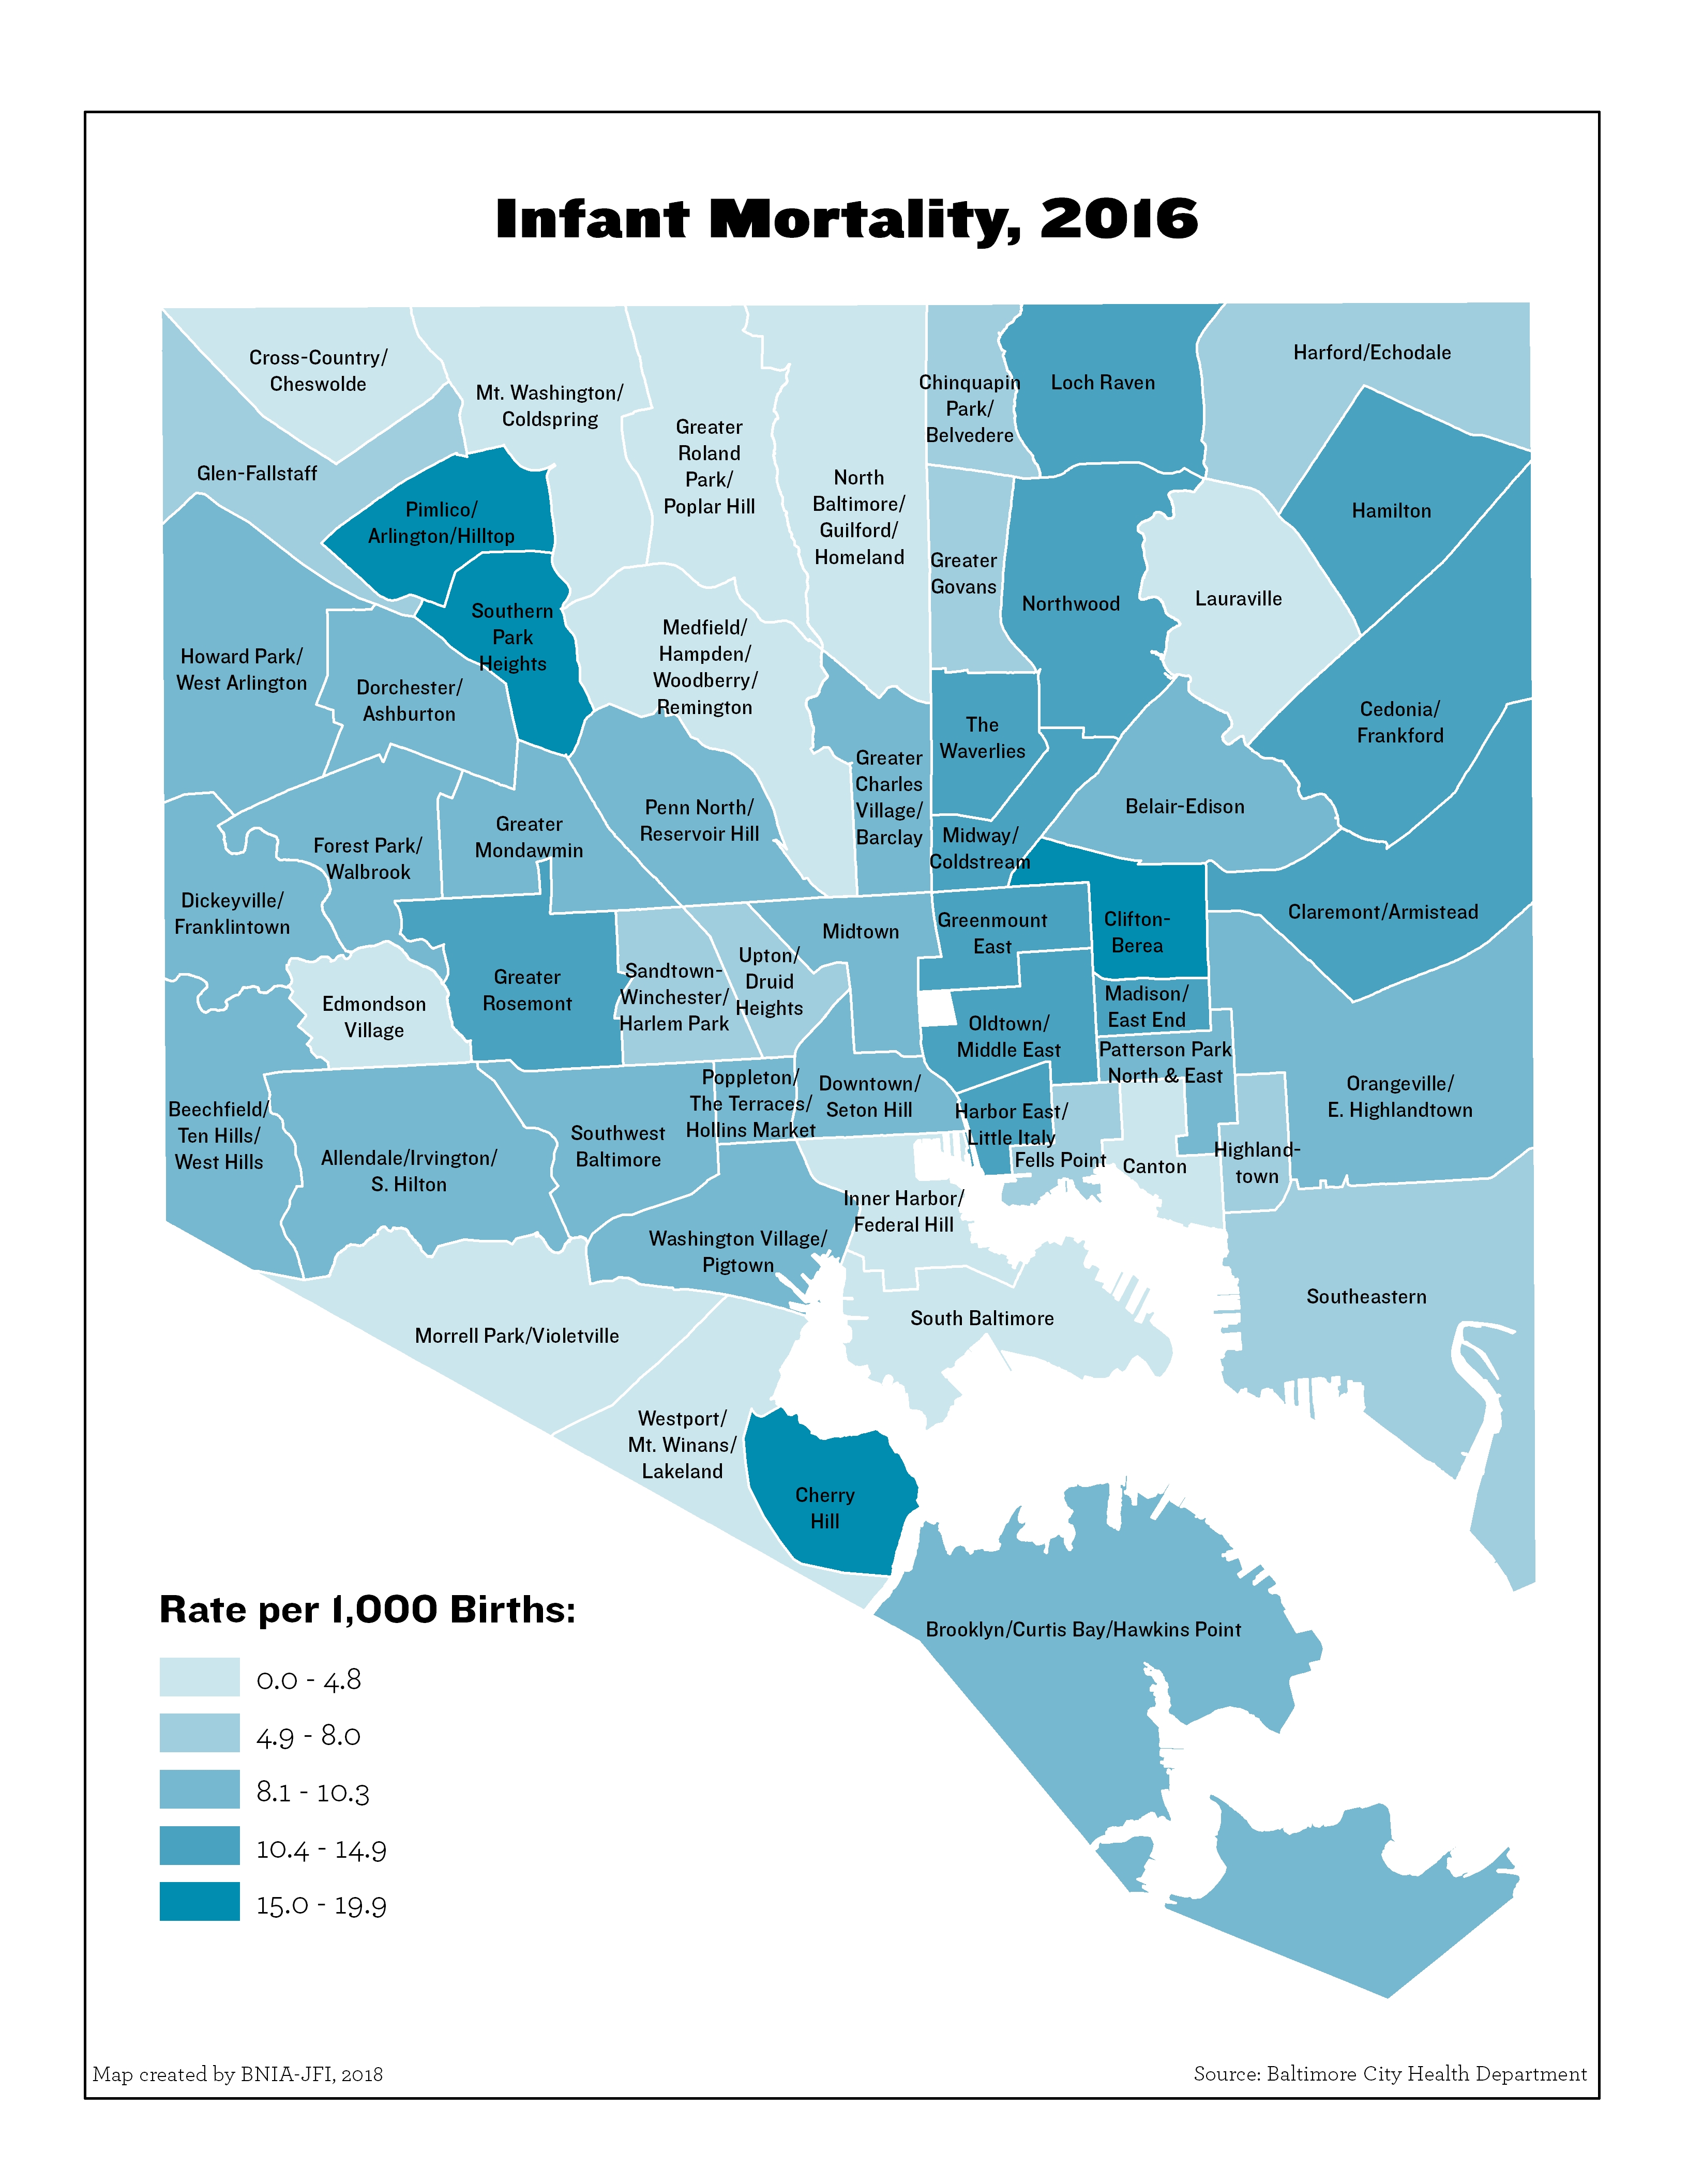
Infant Mortality Rate
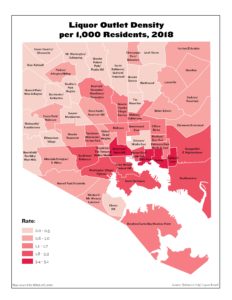
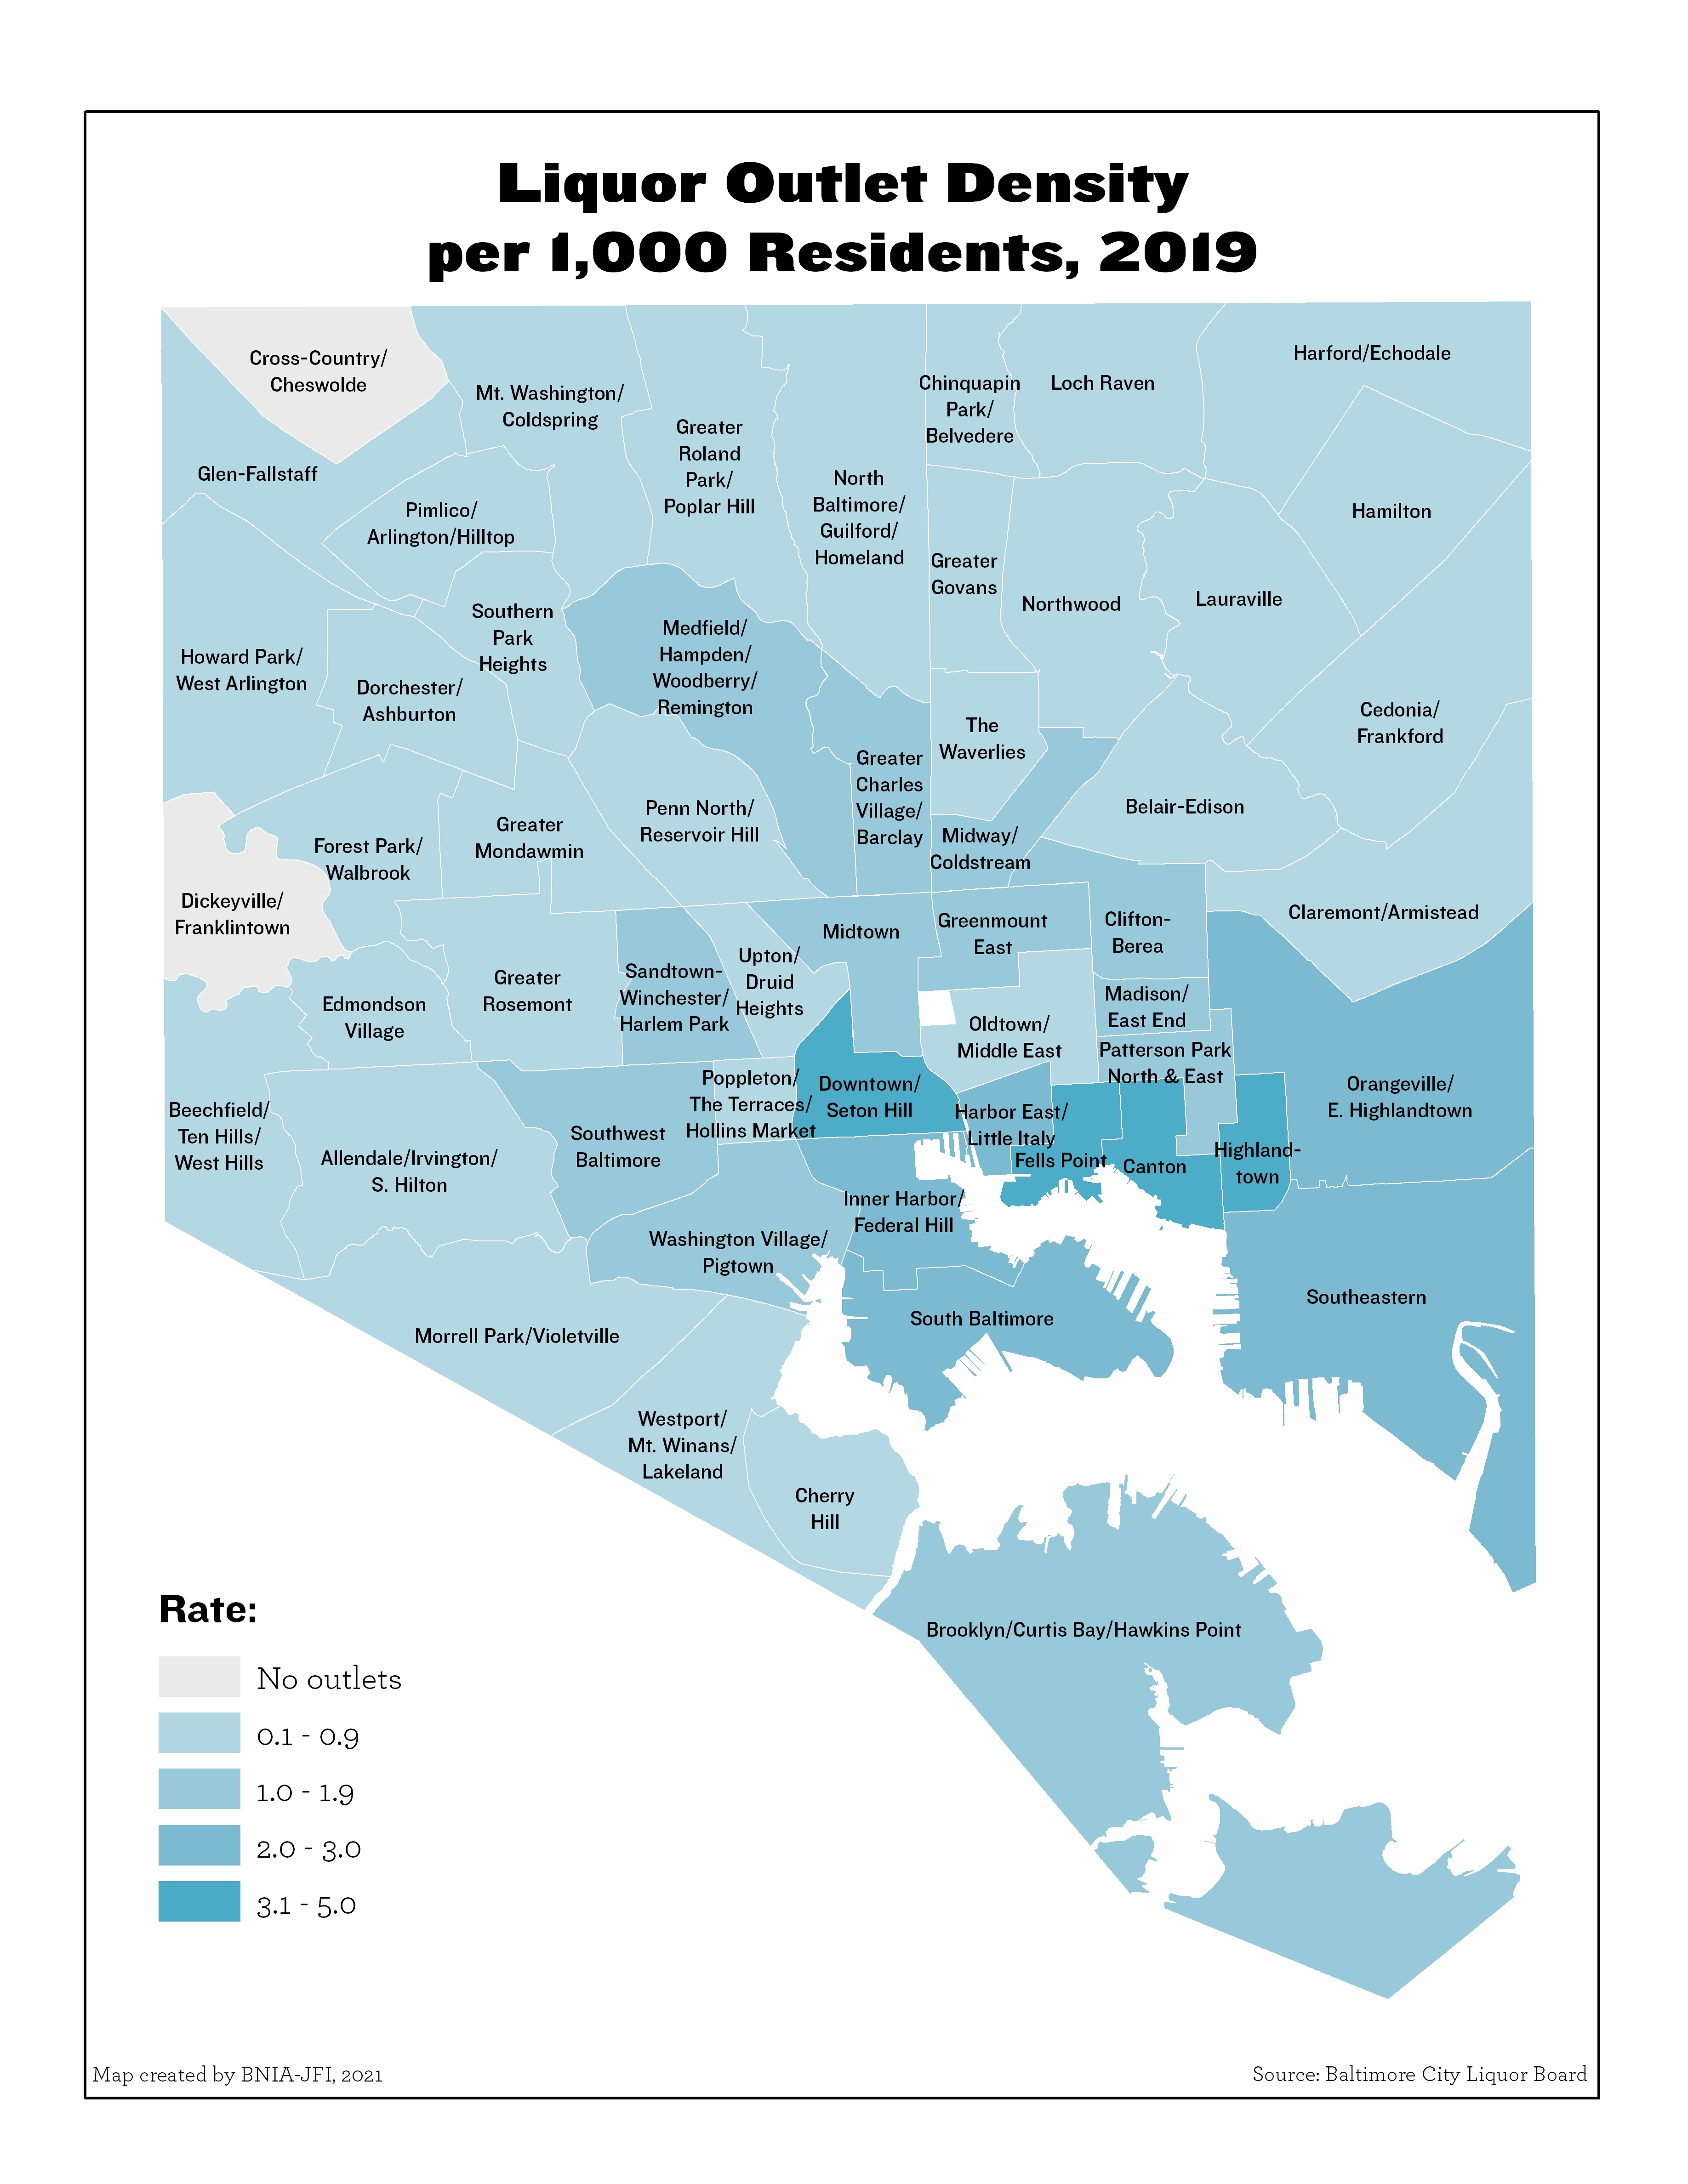
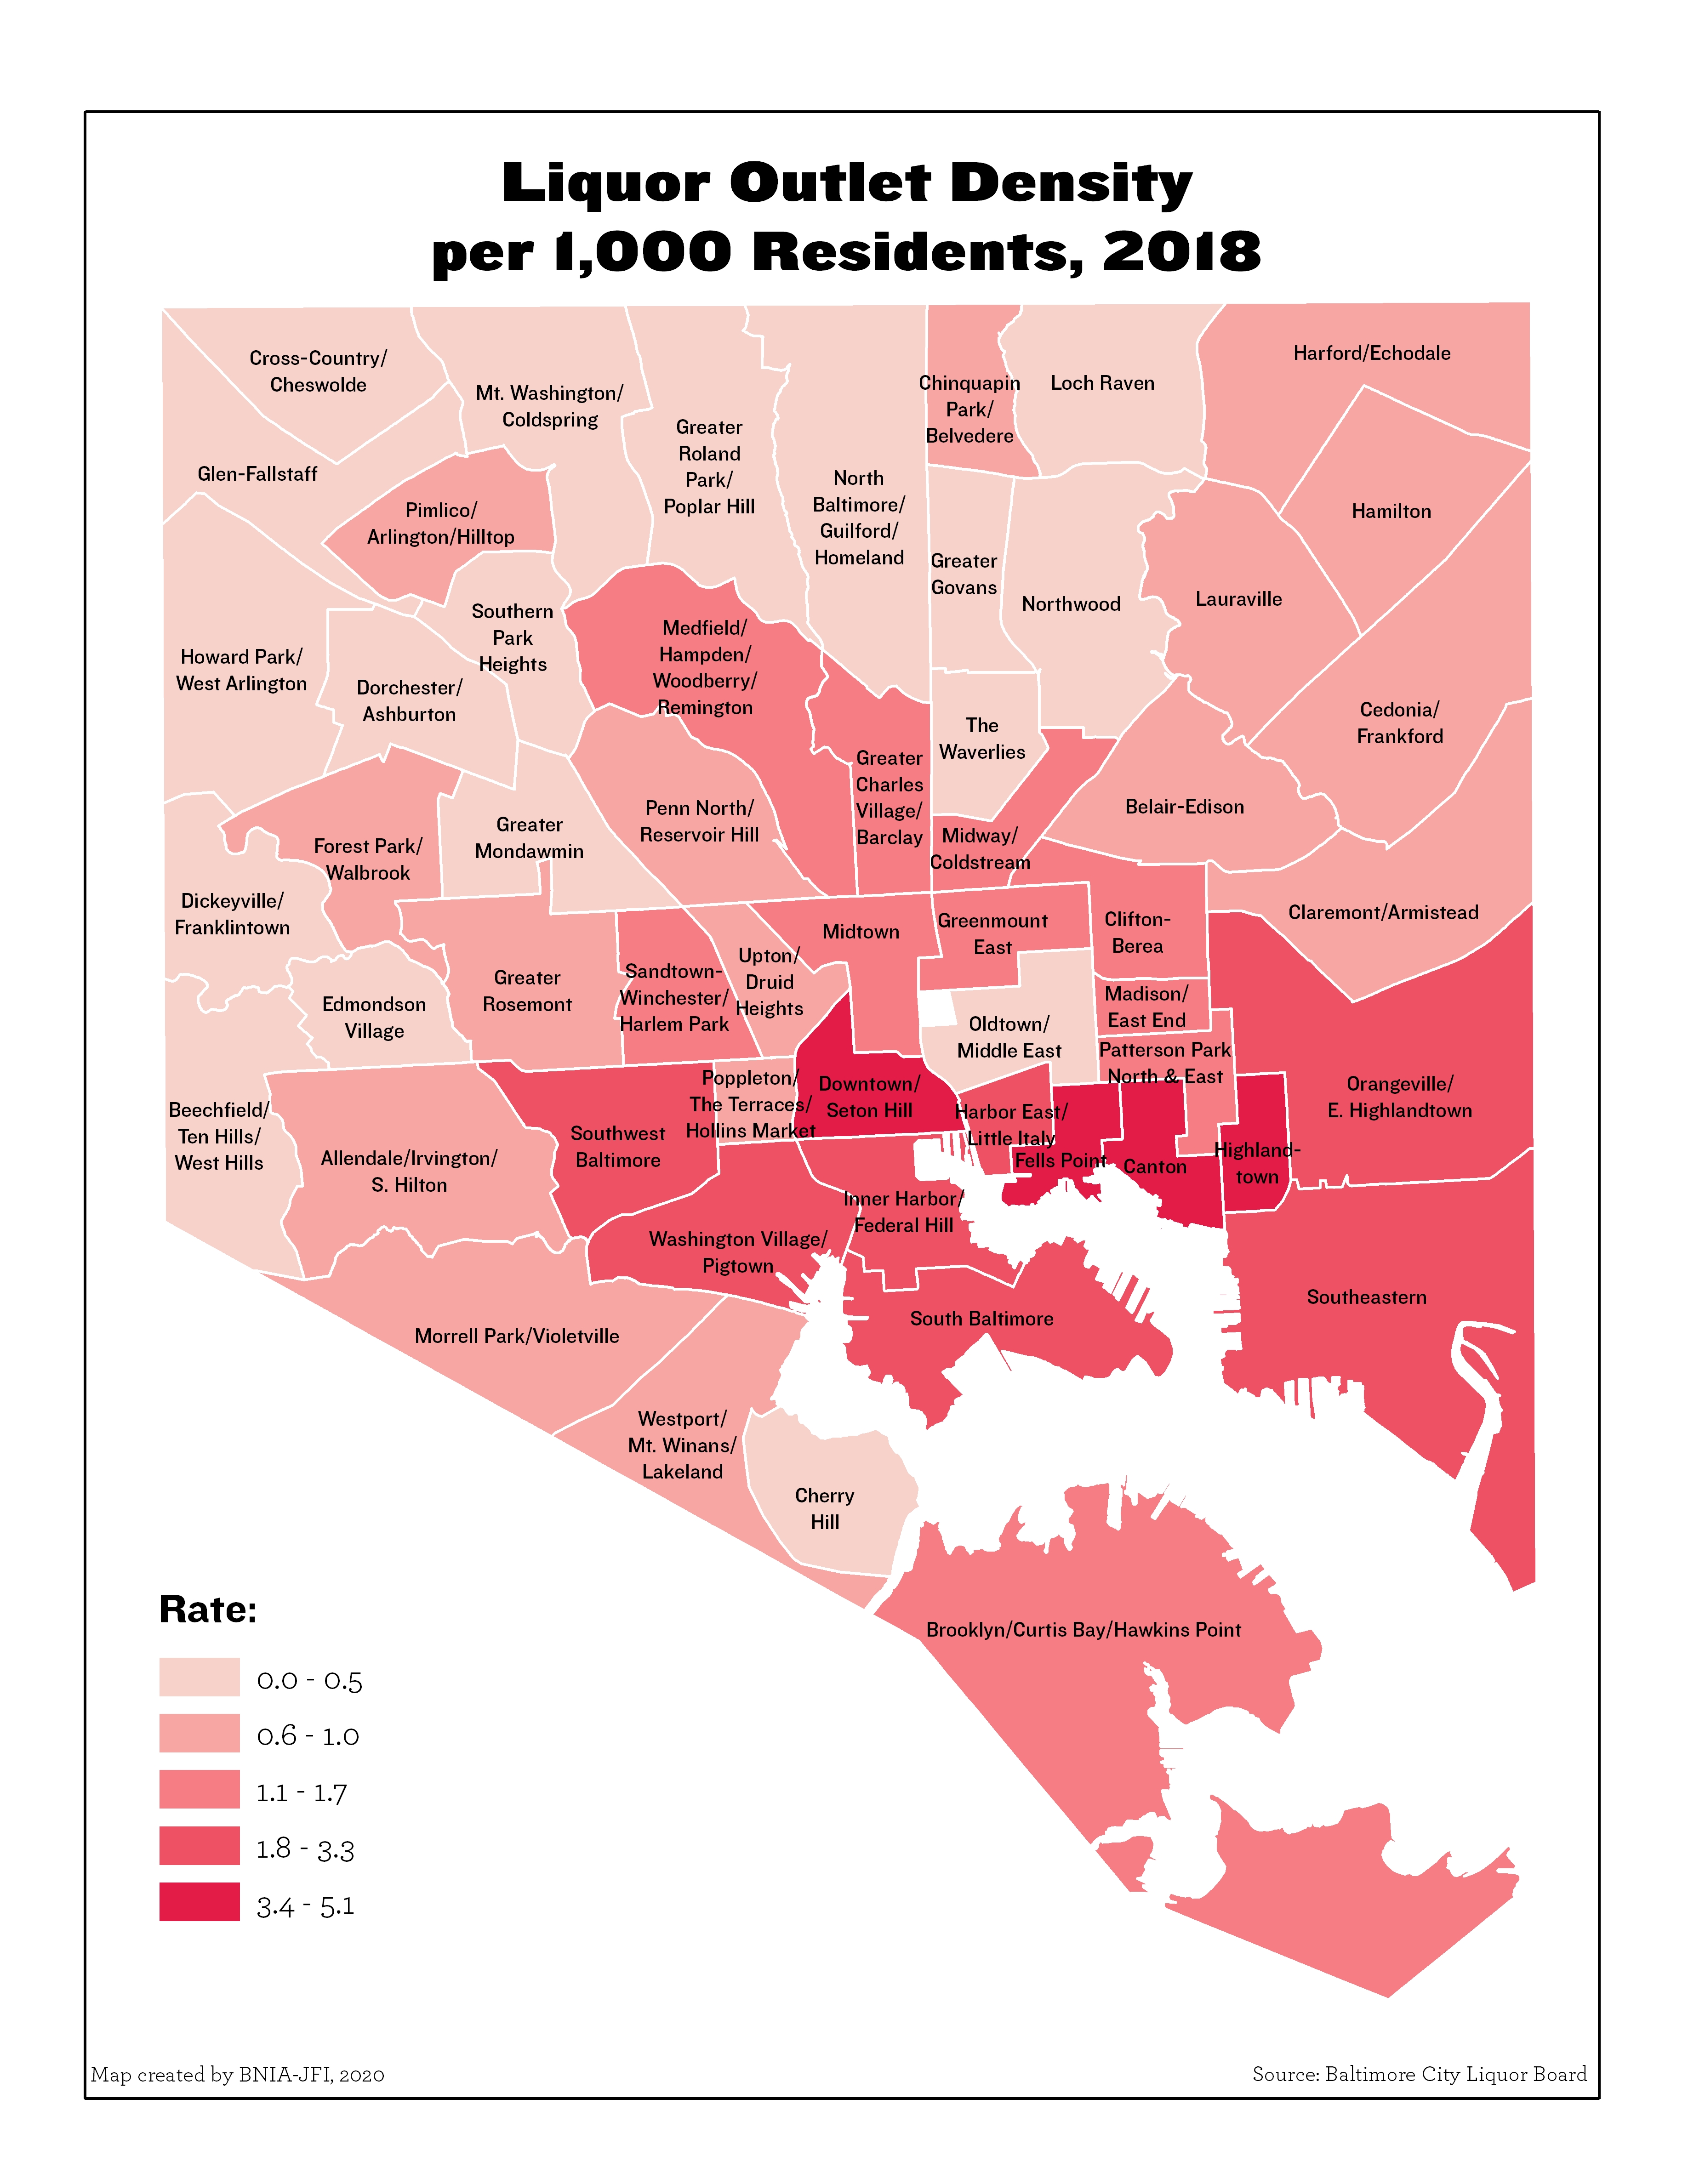
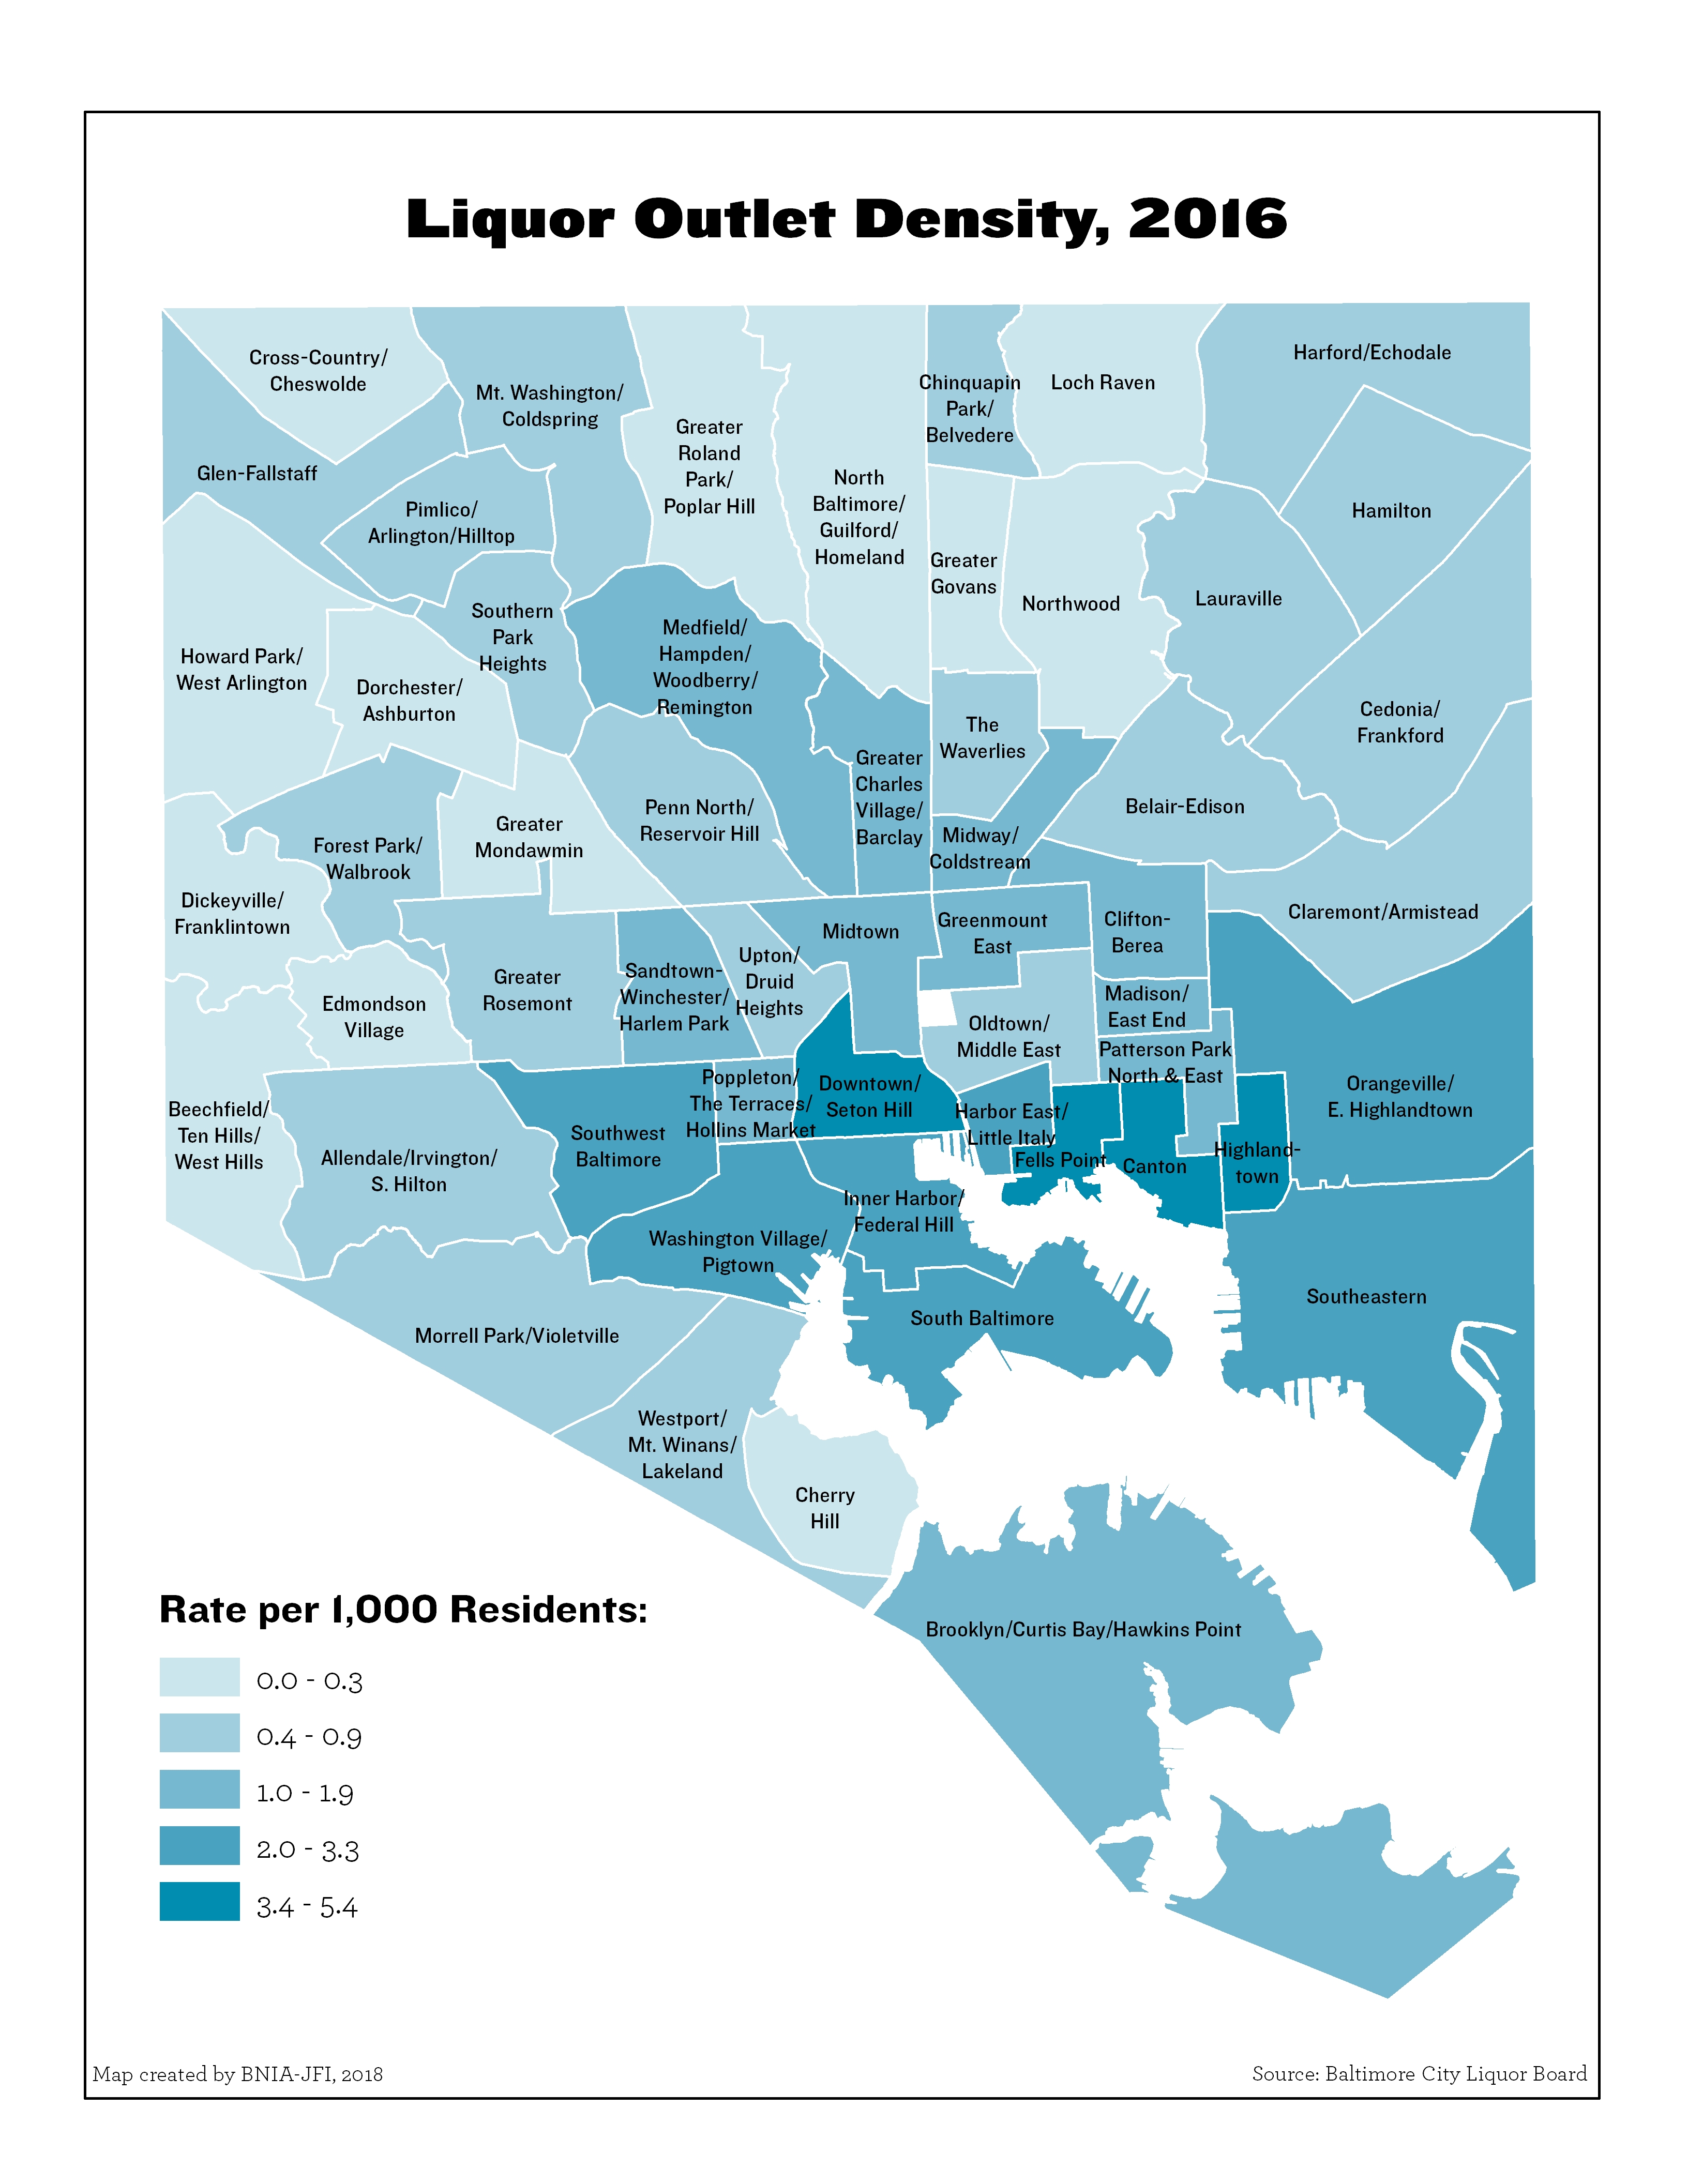
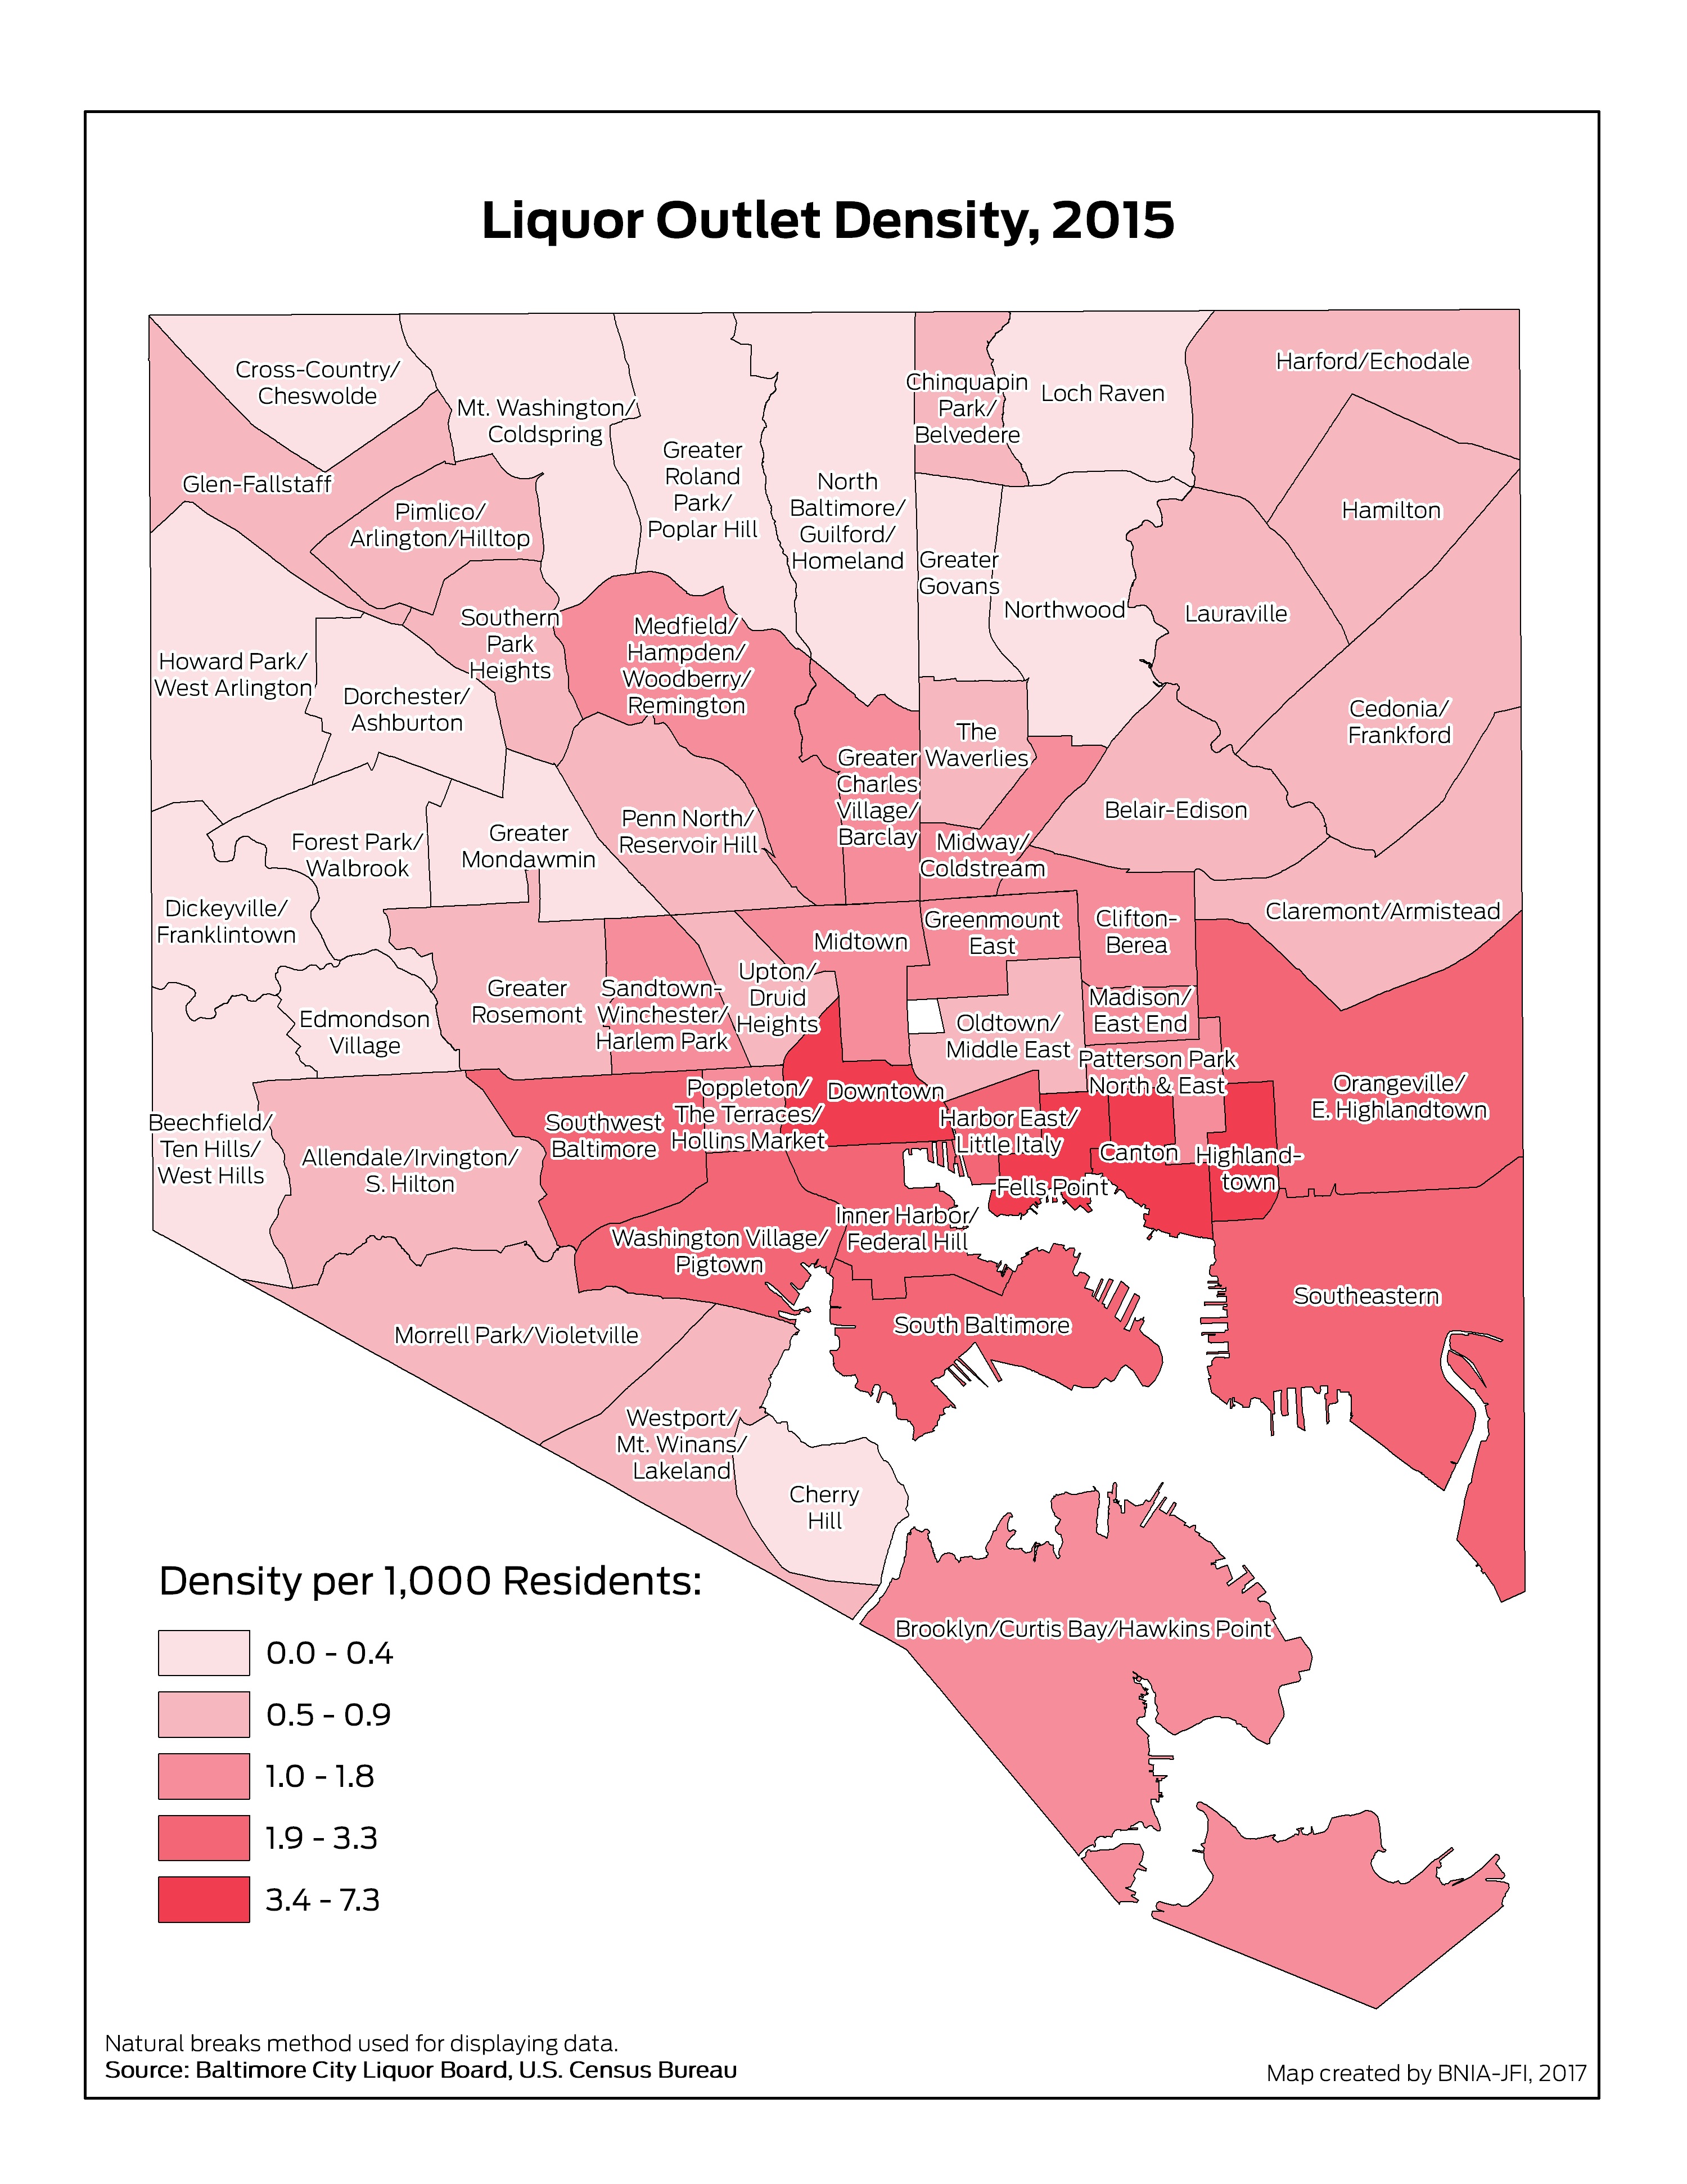
Liquor Outlet Density per 1,000 Residents
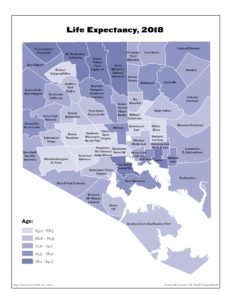
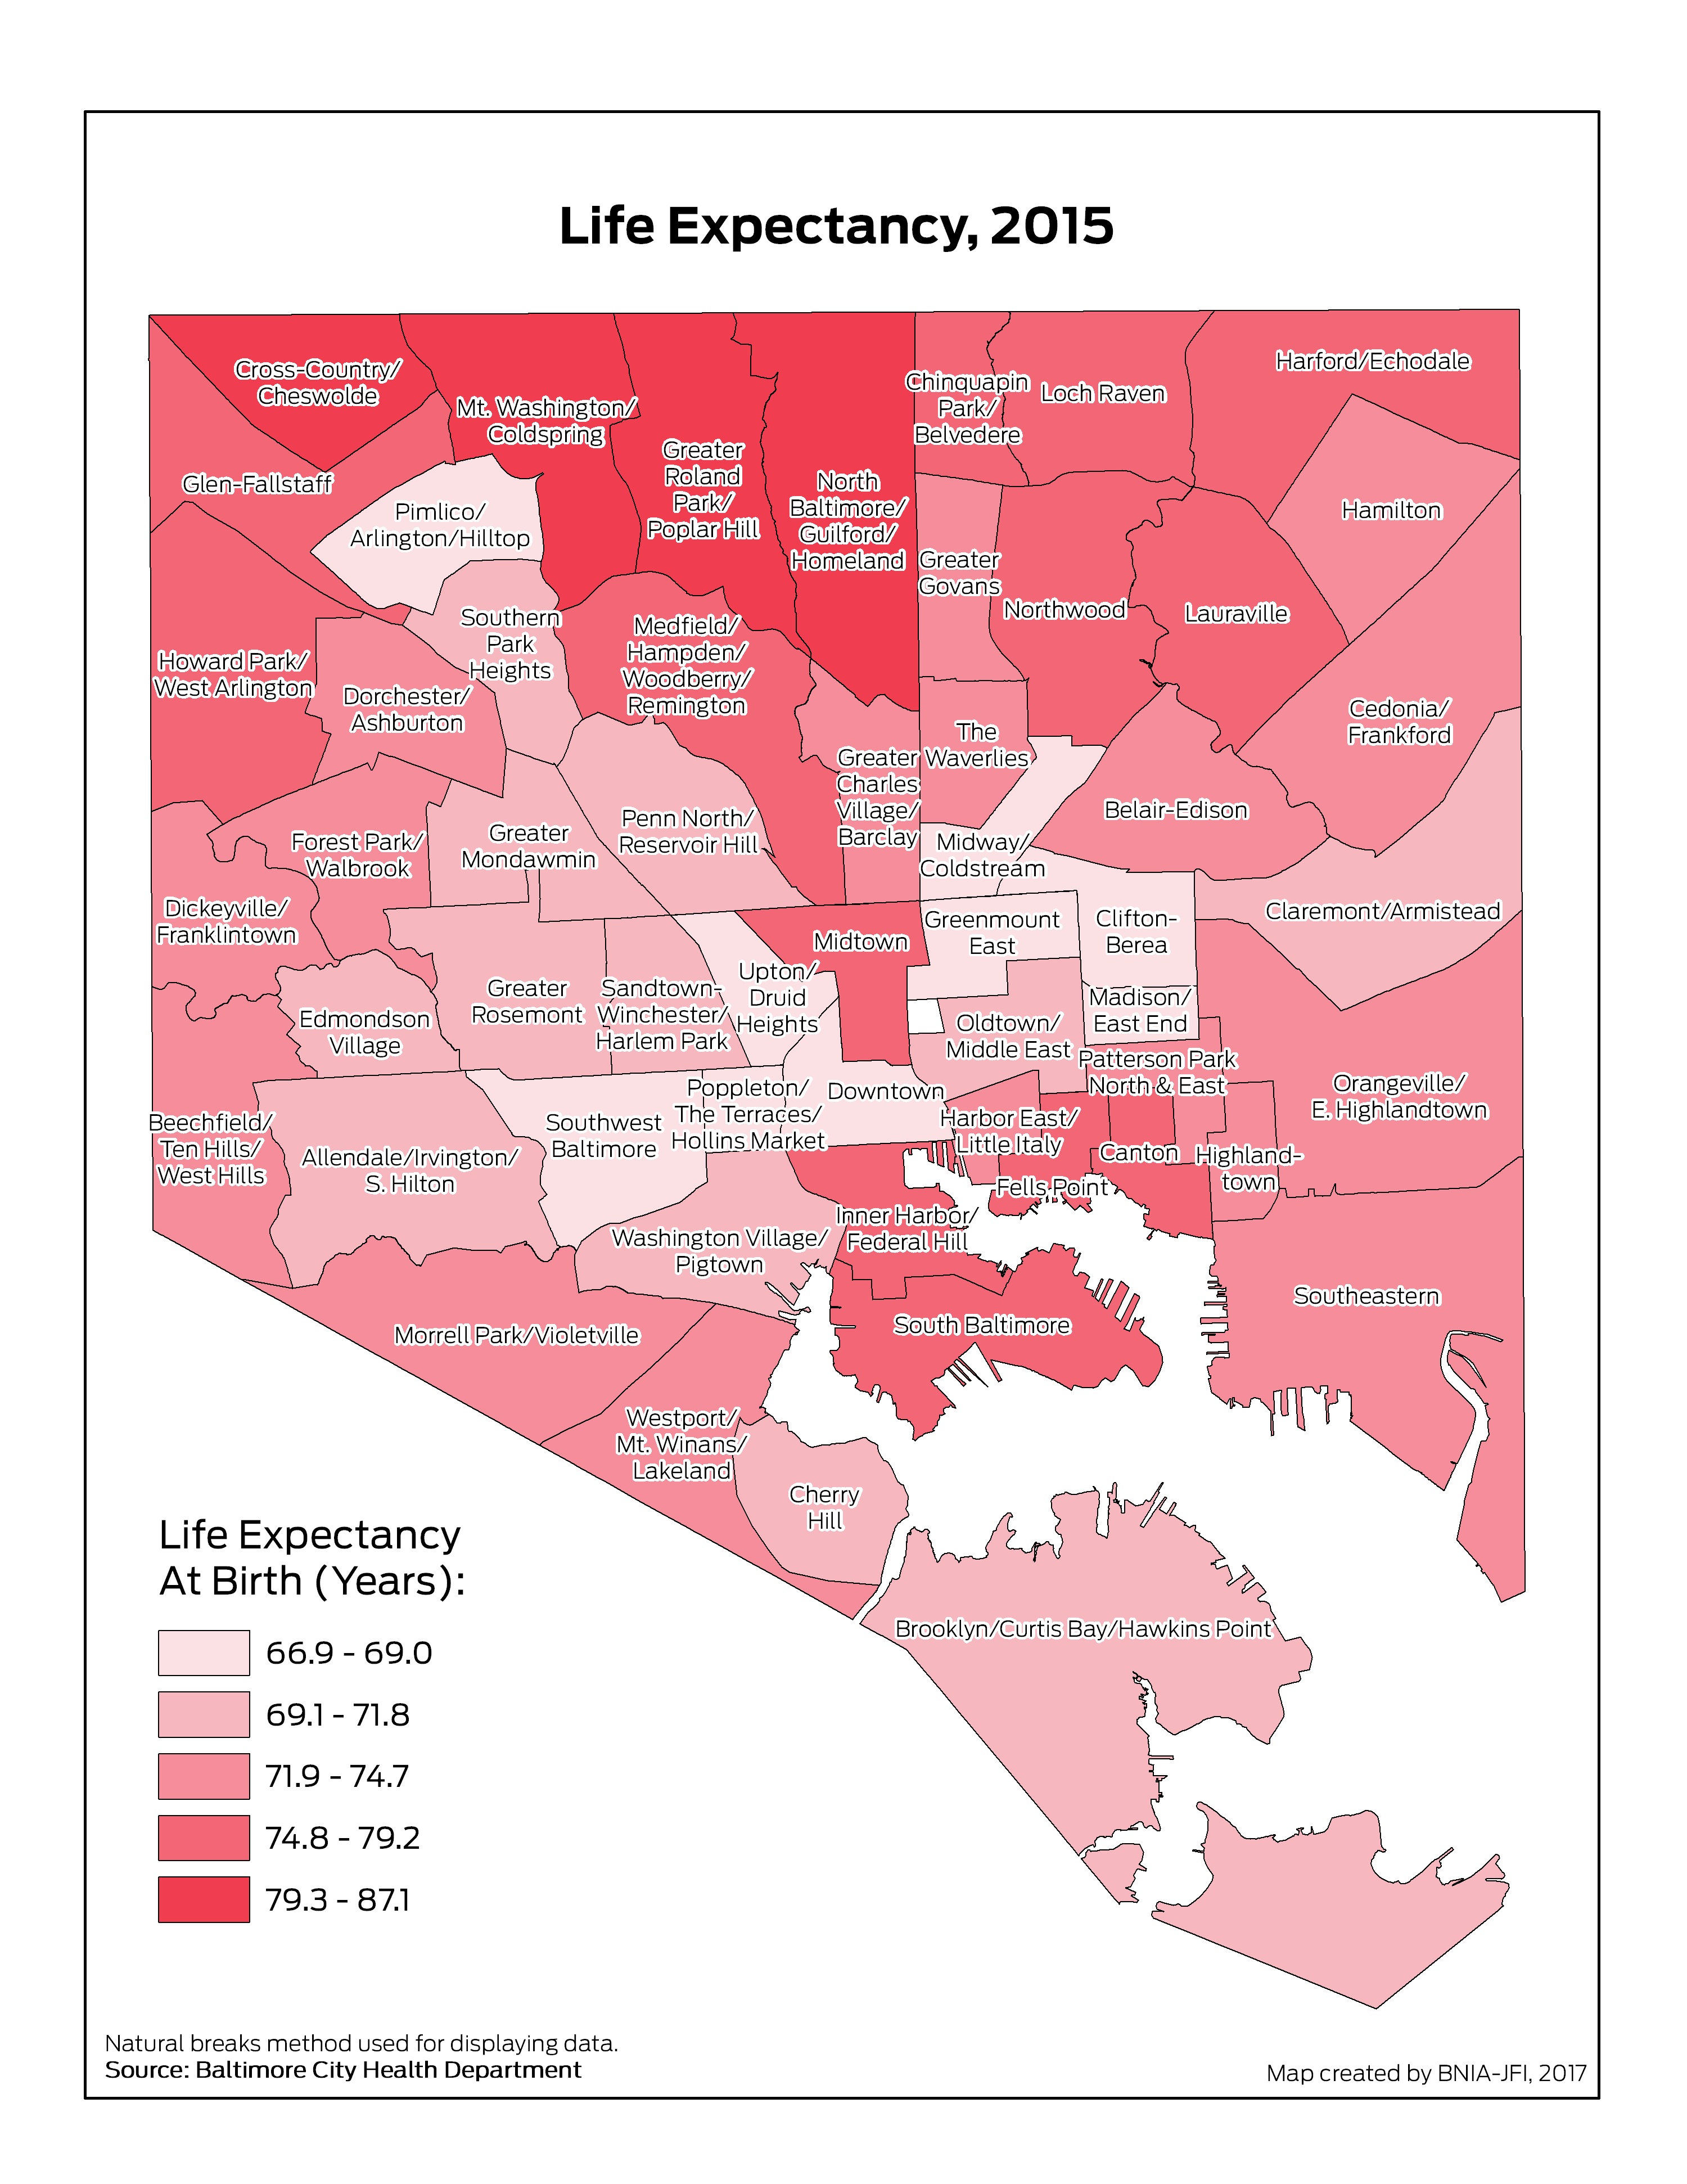
Life Expectancy
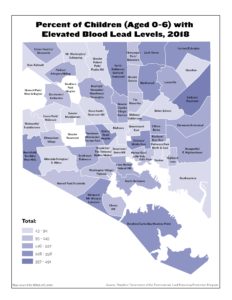
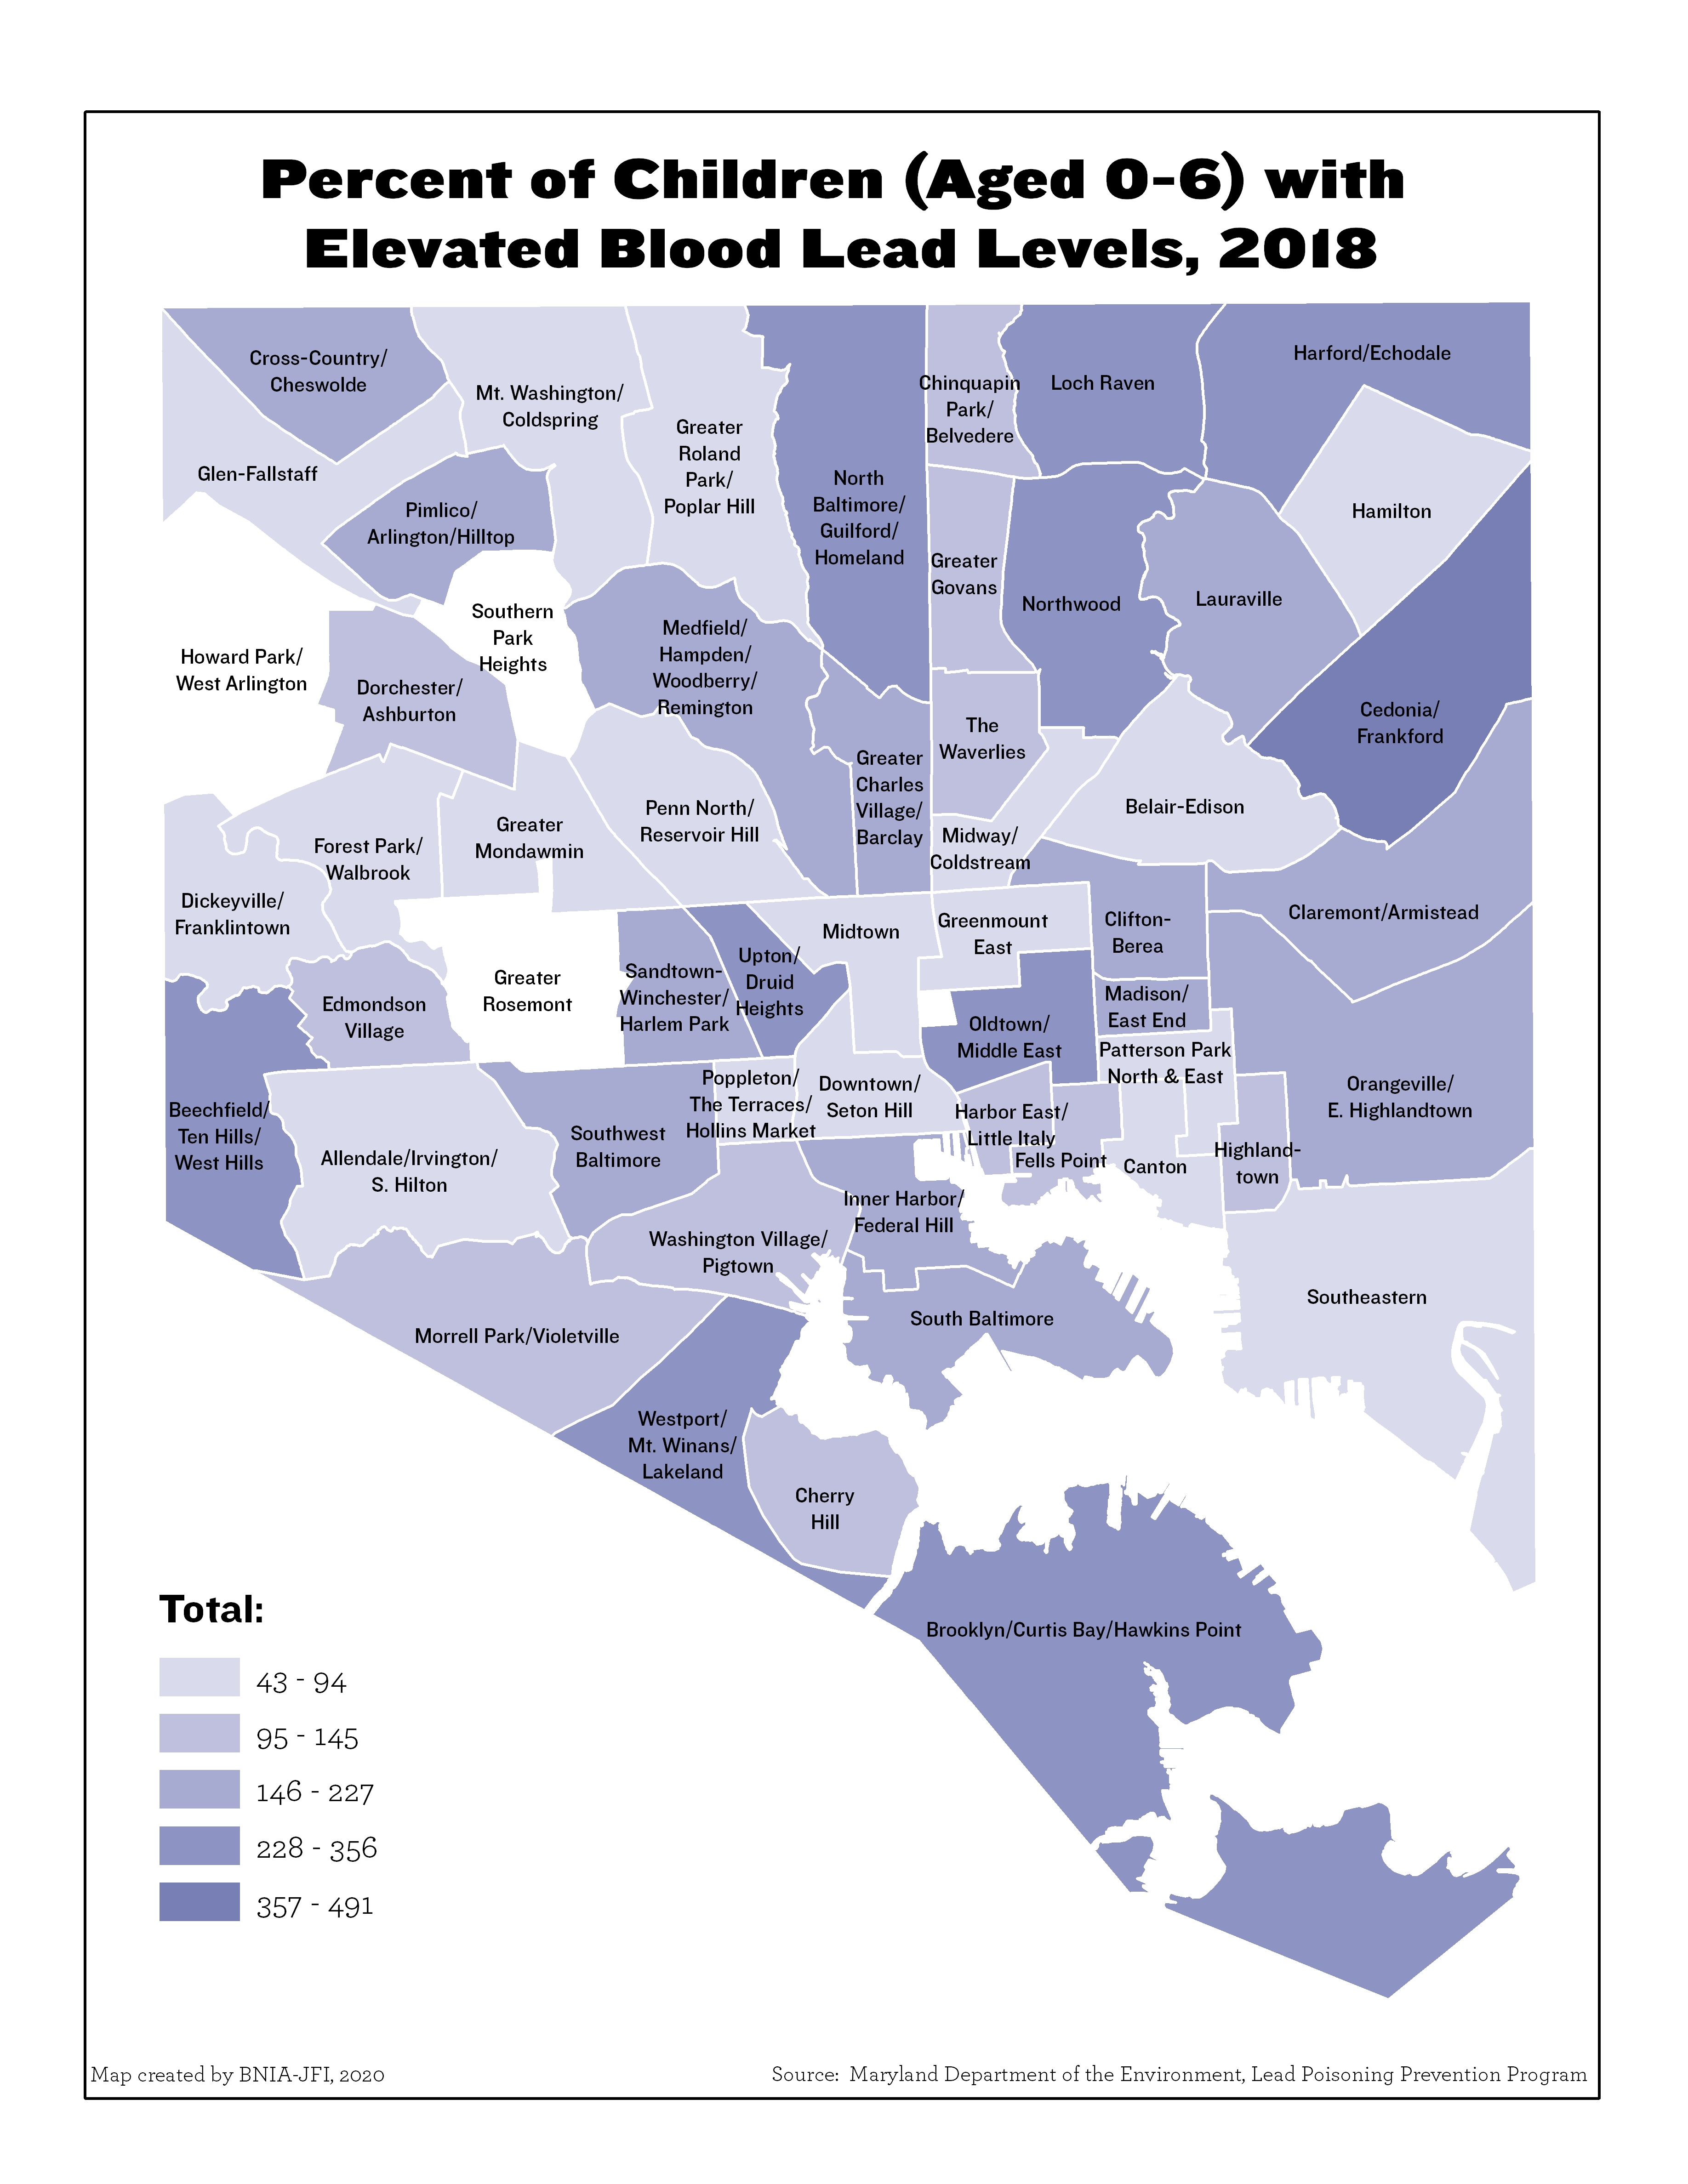
Percent of Children (Aged 0-6) with Elevated Blood Lead Levels
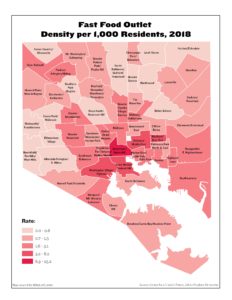
Fast Food Outlet Density per 1,000 Residents
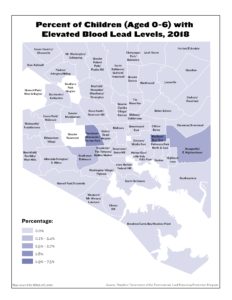
Percent of Children (Aged 0-6) with Elevated Blood Lead Levels

Percent of Babies Born with a Satisfactory Birth Weight